
The Fourier transform of the following time domain function is :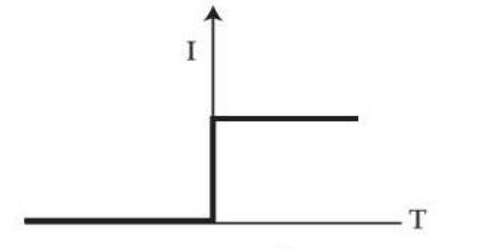
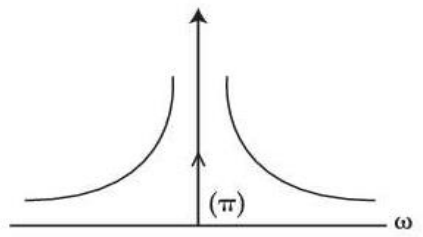
The waveform is a step, and the Fourier transform of a step has two parts — an impulse at the origin and a term falling away as 1/ω — which is the shape drawn in option 1.
\(\mathcal{F}\left\{u(t)\right\}=\pi\delta(\omega)+\dfrac{1}{j\omega}\)
Where each term comes from. Write the unit step as a constant plus a signum function:
\(u(t)=\dfrac{1}{2}+\dfrac{1}{2}\text{sgn}(t)\)
Each half transforms separately.
The constant 1/2. A DC level exists at exactly one frequency, zero, so its transform is concentrated entirely at the origin:
\(\mathcal{F}\left\{\tfrac{1}{2}\right\}=\pi\delta(\omega)\)
This is the impulse marked \(\pi\) in every option — it is what makes the step's average value non-zero, and its presence in all four sketches means it cannot discriminate between them.
The signum part. This carries the transition and gives
\(\mathcal{F}\left\{\tfrac{1}{2}\text{sgn}(t)\right\}=\dfrac{1}{j\omega}\)
whose magnitude is \(1/|\omega|\) — large near the origin and decaying towards zero on both sides. That hyperbolic decay is the discriminating feature, and only option 1 shows it: curves rising steeply as \(\omega\to0\) from either side and falling away symmetrically.
Why the other sketches are wrong in principle. Options 2 and 3 show a magnitude that rises away from the origin and stays high, which would mean the step contains more energy at high frequency than at low — impossible for a waveform that is constant almost everywhere. Option 4 shows a curve dipping to a minimum near the origin, the exact inverse of the true behaviour.
A sanity check that needs no algebra. A step is a slowly varying signal: it changes once and then never again. Its spectrum must therefore be dominated by low frequencies, and the only high-frequency content comes from the single discontinuity — which is why the tail falls as \(1/\omega\) rather than vanishing altogether. A discontinuity always produces a \(1/\omega\) tail; a corner in the waveform would give \(1/\omega^{2}\).
Hence, the correct sketch is option 1.
Similar Questions
Fourier transform or Fourier integral of a function f(t) is given by
Match the following :
List - I List - II (spectrum |G(w)| in the original figure) (a) Rectangular Pulse (i) 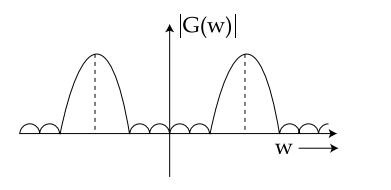
(b) Double-sided Exponential (ii) 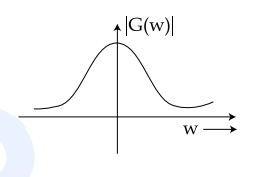
(c) Cosine Pulse (iii) 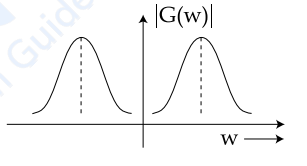
(d) Damped Sine (iv) 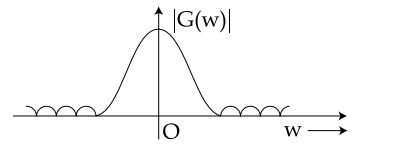
Codes :
Match the following lists :
List – I List – II a. 1 i. \(\pi\delta(\omega)+\dfrac{1}{j\omega}\) b. u(t) ii. 1 c. δ(t) iii. \(\dfrac{-2}{\omega^{2}}\) d. | t | iv. \(2\pi\delta(\omega)\)
Important Questions from Fourier Transform
- The FT of $x(t) = e^{4t} u(-t)$ is:
Fourier transform of the unit impulse δ(t) is
The function f(t) is a periodic function of period 2π. In the range (-π, π), it equals e-t. If f(t) = \(\sum\nolimits_{ - \infty }^\infty {{c_n}{e^{{\mathop{\rm int}} }}}\) denotes its Fourier series expansion, the sum \({\sum\nolimits_{ - \infty }^\infty {\left| {{c_n}} \right|} ^2}\) is
The function f(t) has a Fourier transform F(ω). The Fourier transform of F(t) is
Differentiating a signal in the time domain corresponds to _________ its FT in the frequency domain by _________.



