
The following figure shows the production of mobiles in lakh units of four cities in different years. Study the figure and answer the question that follows.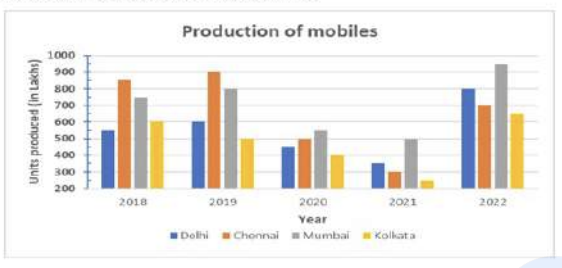
What is the ratio between the average production in Delhi and Kolkata during the period of 2019 to 2022?
11 : 9
By calculating the average production in both cities for the given years and simplifying the ratio, we get 11:9.
Similar Questions
Study the given graph carefully and answer the question that follows.
The given graph shows the number of male and female volunteers for helping handicapped people from four different districts A, B, C, and D.
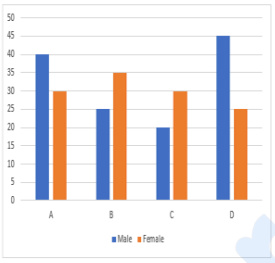
Find the number of volunteers altogether.
Study the given table and answer the question.
The table displays the number of cars produced (in lakhs) by six different brands between 2018 and 2023.
Brand 2018 2019 2020 2021 2022 2023 A 36 40 42 45 47 42 B 23 37 28 32 36 48 C 45 47 51 54 56 46 D 35 37 42 32 36 28 E 57 56 52 38 48 42 F 43 45 56 41 52 40 Which brand production is the highest, and in which year?
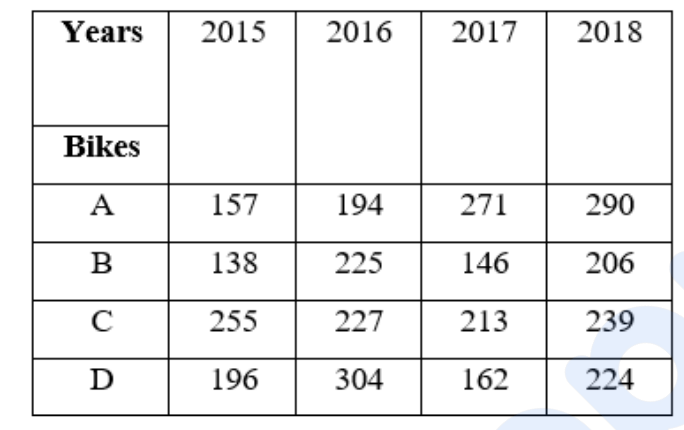
The number of years, in which the production of bikes of type C is less than the average production of type A bikes over the years is:
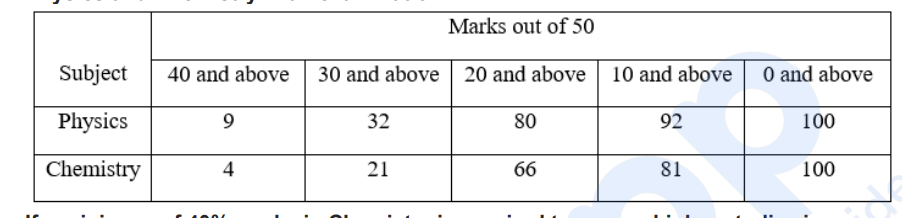
The following table shows the categorisation of 100 students based on their marks in Physics and Chemistry in an examination.
If a minimum of 40% marks in Chemistry is required to pursue higher studies in Chemistry, how many students will be eligible to pursue higher studies in Chemistry?
The given table shows the number of televisions that were sold by different showrooms in years 2015 to 2019.
Year/Showroom A B C D 2015 212 200 205 208 2016 210 215 225 220 2017 190 204 212 205 2018 198 212 222 224 2019 218 192 205 203 Find the difference between the sale of televisions from showrooms A, B, and C in 2017 and the sale of televisions from showrooms B, C, and D in 2019.
The following table shows the expenditures (in thousands of rupees) of a company in different categories from 2015 to 2019.
Year Salary Fuel and Transport Bonus Interest on loans Taxes 2015 288 98 3 23.4 83 2016 343 112 2.52 32.5 108 2017 324 101 3.84 41.6 74 2018 336 133 3.68 36.4 88 2019 420 142 3.96 49.6 98 What is the average amount (in ₹) paid by the company on fuel and transport per year from 2015 to 2019?
In 2010, a company’s total expenditure was categorised under different expense heads, and their percentage distribution is illustrated in the bar graph given below.
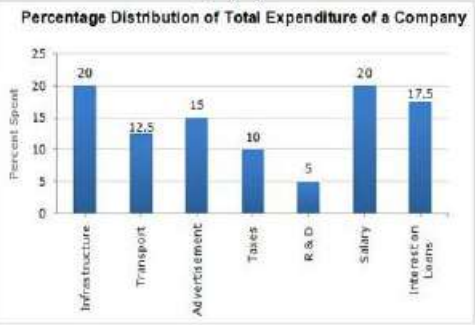
If the expenditure on an advertisement is ₹2.1 crore, then the difference between the expenditure on transport and taxes is:
Refer the below table and answer the question that follows.
Discipline Boys Girls Engineering 120 80 Medical 80 120 What percentage of students who chose medical are boys?
The given pie chart shows the amount of money (₹) spent (in degrees) on various sports by a sports academy in a particular year. Study the pie chart and answer the question that follows.
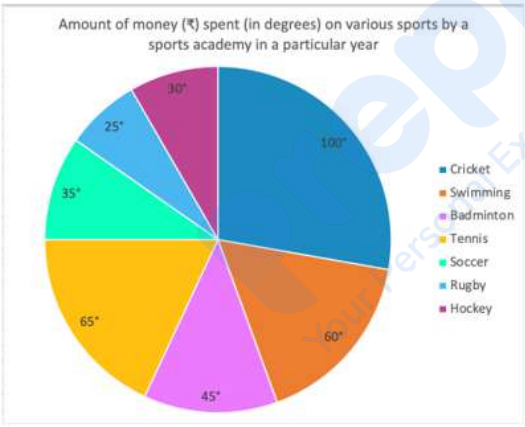
If ₹42,000 were spent on Soccer, then the money spent on Badminton, Tennis and Rugby taken together is what percentage (rounded off to 2 decimal places) more/less than the money spent on Cricket, Swimming and Hockey taken together?
Study the given table and answer the question that follows.
The table represents the number of scooters (in thousands) manufactured by four companies A, B, C, and D from the period 2012 to 2015.
Years A B C D 2012 360 420 380 520 2013 580 940 570 980 2014 1000 780 1020 1090 2015 1240 950 1180 1660 The average number of scooters produced by company D is what percent (rounded off to 2 decimal places) more than the combined average number of scooters produced by the three companies A, B, and C?
Important Questions from Data Interpretation
The table below shows the number of toys of 6 different colours sold from a shop during a given period. The table also shows the percentage of toys of each colour which are cars.
Colour Total toys Percentage of cars C1 500 12 C2 600 15 C3 400 12.5 C4 550 10 C5 650 20 C6 450 10 What is the total number of car toys of C2 and C3 taken together?
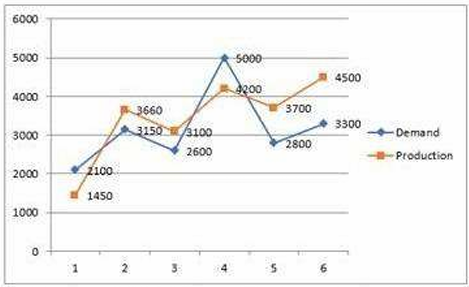
Study the given graph carefully and answer the question that follows. The graph shows the demand and production of different companies.
The ratio between the companies having more production than demand and more demand than production is:
Study the given table and answer the question that follows. The given table shows the number of new employees added to different categories of employees in a company for four years and the number of employees from these categories who left the company every year.
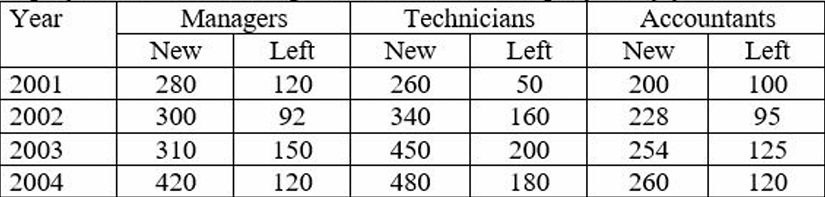
During the period between 2001 and 2004, the total number of Technicians who left the Company is what percentage (rounded off to the nearest integer) of the total number of Technicians who joined the Company?
The given pie-chart shows the percentage distribution of 20,000 employees in a company. Study the given chart and answer the question that follows. If 30% of the employees in department D are females, then how many male employees are there in that department?
The given pie chart shows the expenditure by a state government on various sports during a particular year. If the total amount spent on tennis and football is ₹1,45,000, then the total amount (in ₹) spent on all the given sports is:



