The following bar graph shows the sale of three cold drinks (in thousands) over a period of 5 years. Study the graph carefully and answer the question that follows. Find the maximum average annual sale of any cold drink in the given period.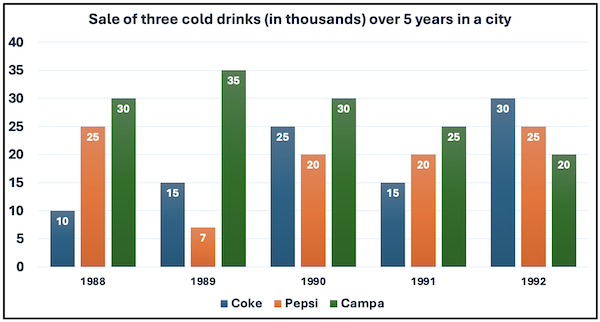
28,000
Read the sales (in thousands) from the graph for 1988-1992.
Coke: 10 + 15 + 25 + 15 + 30 = 95, average 19.
Pepsi: 25 + 7 + 20 + 20 + 25 = 97, average 19.4.
Campa: 30 + 35 + 30 + 25 + 20 = 140, average 28.
The maximum average annual sale is Campa's 28 thousand, that is 28,000.
Hence, the answer is 28,000.
Similar Questions
The following bar graphs show the average marks (out of 100) in five subjects obtained by Boys and Girls in Class 8 of a school.
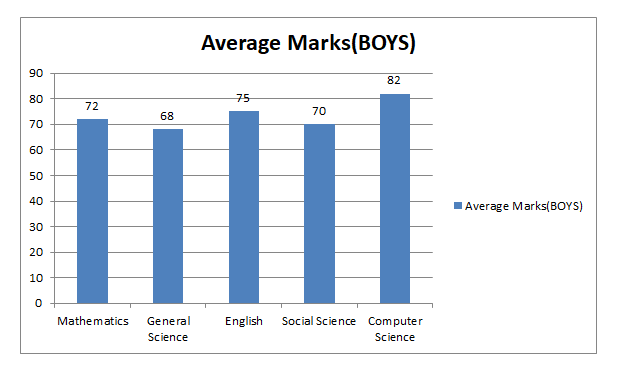
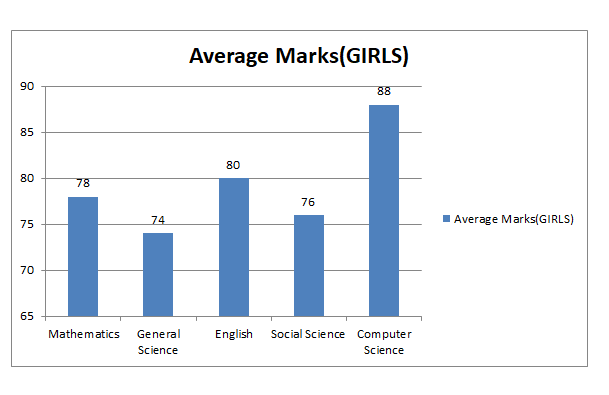
Compute the difference between overall average score for Girls and Boys (to one decimal place).
Study the following bar diagram carefully and answer the following question.
The bar graph shows the production of electronic items (ACs and Refrigerators) in a factory during the period from 2020 to 2024.
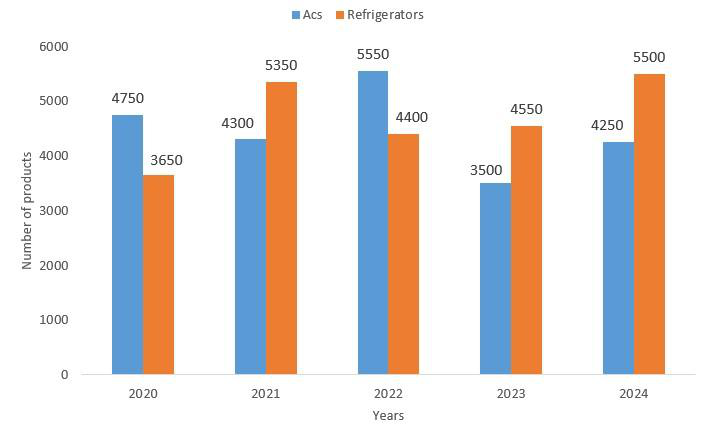
The difference between averages of production of Refrigerators and ACs from 2021 to 2024 is:
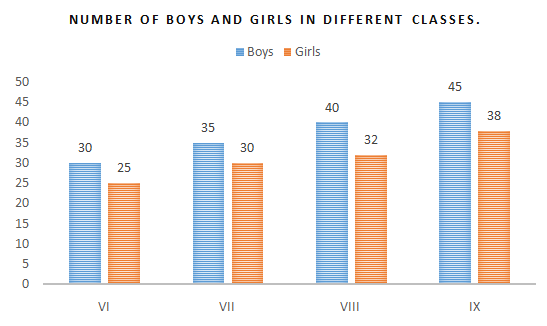
The given bar graph shows the number of boys and girls in different classes. If 20% of the boys and 25% of the girls from Class VIII participate in a competition, then how many students from Class VIII participate in the competition?
The following bar graph shows the electricity consumption (in kWh) for five households (Family A, B, C, D, E) over a period of three months (January to March).
Electricity Consumption (in kWh)0255075100125150175200120130145Family A150160170Family B150140130Family C140155160Family D110100125Family EJanuaryFebruaryMarch
Which family is with the highest electricity consumption and determine how much more they consumed (in kWh) compared to the family with the lowest usage over the three-month period?
The multiple bar graph below represents the number of students enrolled in three different courses (Science, Commerce and Arts) in a college over five years.
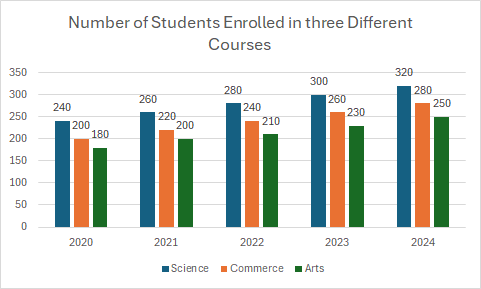
What was the average number of Commerce students enrolled over the given five years?
The given bar graph shows the total number of students enrolled each year from 2015 to 2019 in two different summer camps: Sunshine and Aryan.
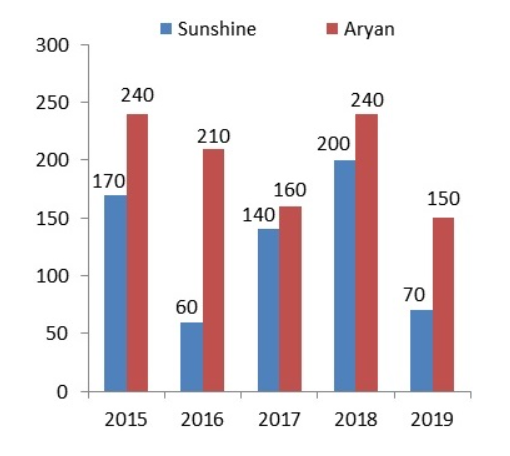
The total number of students enrolled in Sunshine from 2016 to 2019 is what percentage more than the total number of students enrolled in Aryan in 2018 and 2019? (Round off your answer to two decimal places.)
The following bar graph shows the number of soldiers recruited (in thousands) in three different forces in six different years. Study the following graph carefully to answer the question that follows.
Soldiers Recruited (in thousands)010203040506070102535202020301020212540102022356015202335504020244030502025ArmyAirforceNavy
What was the percentage increase in the number of soldiers recruited in Airforce in the year 2022 as compared to the previous year?
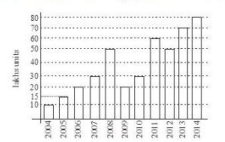
The bar graph below shows information on personal computers sold by company XYZ in the last 10 years. During 2004 to 2010, in which year were sales maximum?
The bar graph represents production of three grains P, Q, R in four states A, B, C and D.
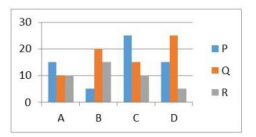
What percentage of the total production of grain Q across all states is produced by state D (to one decimal place)?The following bar graph shows PCs sold by company XYZ in the last 10 years. During 2010-2014, in which year were sales maximum?
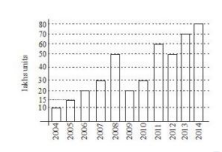
Important Questions from Bar Graph
Directions:
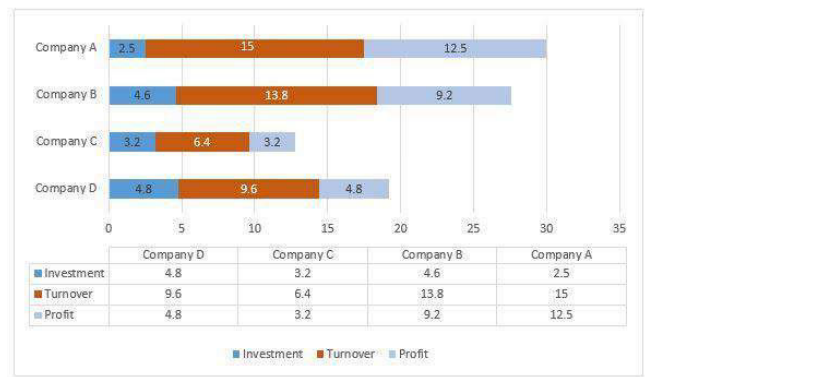
Study the following Bar-chart and the data provided to answer the questions that follow:
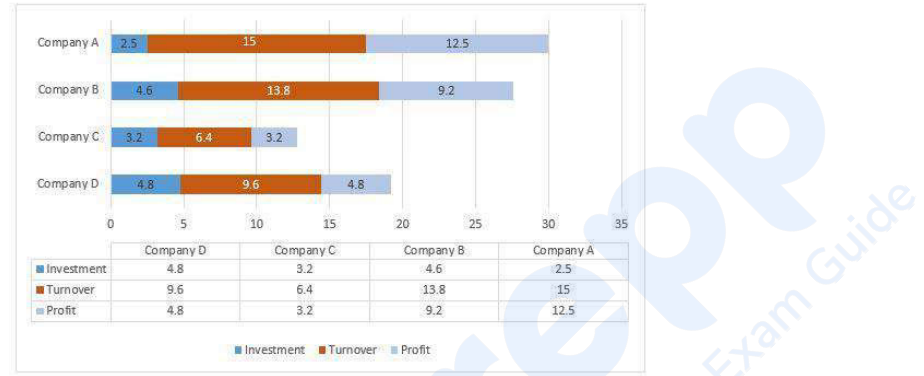
Investment, Turnover and Profit of four different companies A, B, C and D are given. (In Lakhs)
What percentage of turnover of company D is profit of company C. (Upto two decimals).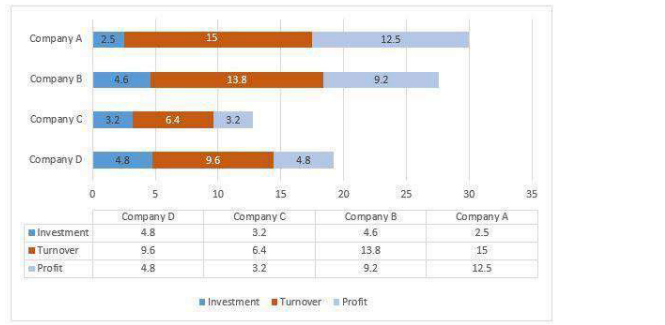
- Find the total number of employees in factory Q over the given years. (In hundreds)
- What is the average number of employees in factory R over the given years approximately? (In hundreds)
Study the following Bar-chart and the data provided to answer the questions that follow:Investment, Turnover and Profit of four different companies A, B, C and D are given. (In Lakhs)Investment, Turnover and Profit of four different companies A, B, C and D are given. (In Lakhs)Out of the given four companies which one has highest profit proportion? (Profit proportion = Profit/Investment)
Directions:
Study the following Bar-chart and the data provided to answer the questions that follow:
Investment, Turnover and Profit of four different companies A, B, C and D are given. (In Lakhs)
What is the gain percentage of Company C?