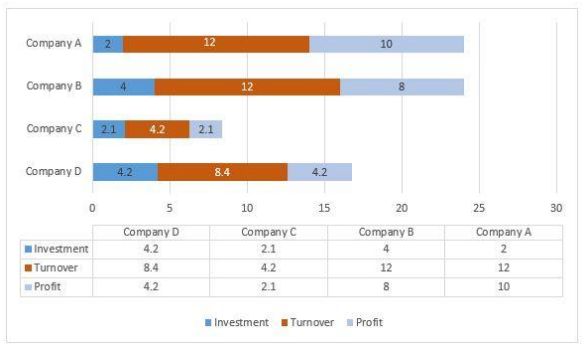
Directions: Study the following graph carefully and answer the questions given below.
The given bar graph represents the number of employees in three different factories P, Q and R over the given years. (In hundreds)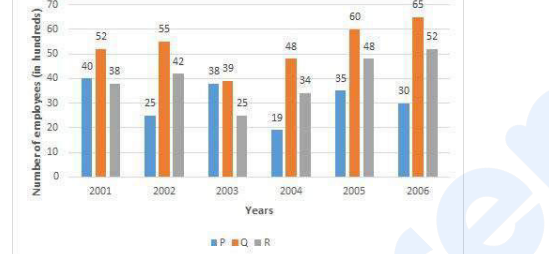
To find the total number of employees in factory Q over the given years, we need to sum up the number of employees for each year as presented in the bar graph. The values represent hundreds of employees, so we need to consider them accordingly.
Let's consider the data from the bar graph:
- Year 1: 50 employees (in hundreds)
- Year 2: 60 employees (in hundreds)
- Year 3: 52 employees (in hundreds)
- Year 4: 59 employees (in hundreds)
- Year 5: 98 employees (in hundreds)
Now, let's calculate the total number of employees over these years:
Total employees = (50 + 60 + 52 + 59 + 98) hundreds.
Calculating the sum:
Total employees = 50 + 60 + 52 + 59 + 98 = 319 hundreds.
Therefore, the total number of employees in factory Q over the given years is 319 hundreds.
Hence, the correct answer is 319.
Important Questions from Bar Graph
Directions:
Study the following Bar-chart and the data provided to answer the questions that follow:
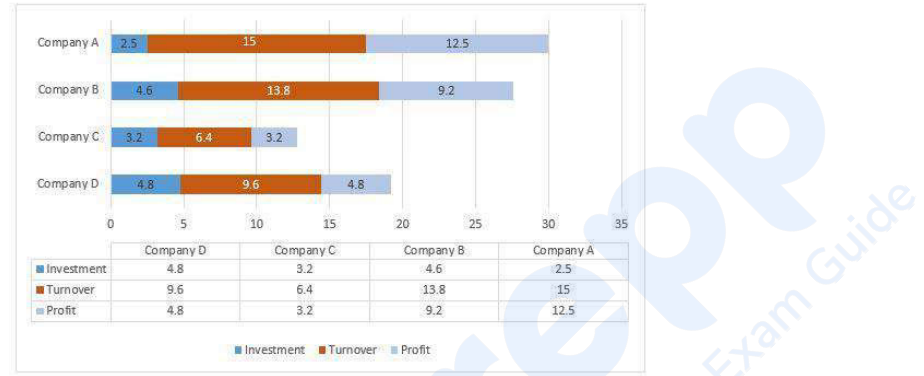
Investment, Turnover and Profit of four different companies A, B, C and D are given. (In Lakhs)
What percentage of turnover of company D is profit of company C. (Upto two decimals).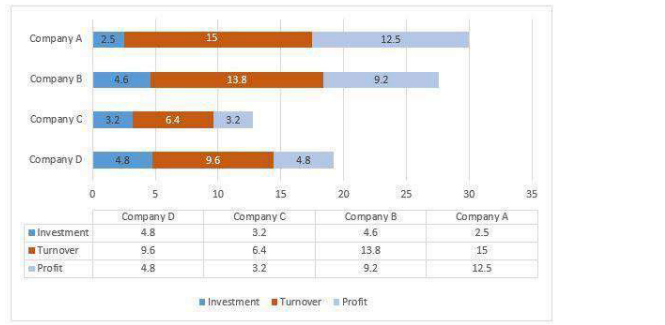
- What is the average number of employees in factory R over the given years approximately? (In hundreds)
Study the following Bar-chart and the data provided to answer the questions that follow:Investment, Turnover and Profit of four different companies A, B, C and D are given. (In Lakhs)Investment, Turnover and Profit of four different companies A, B, C and D are given. (In Lakhs)Out of the given four companies which one has highest profit proportion? (Profit proportion = Profit/Investment)
Directions:
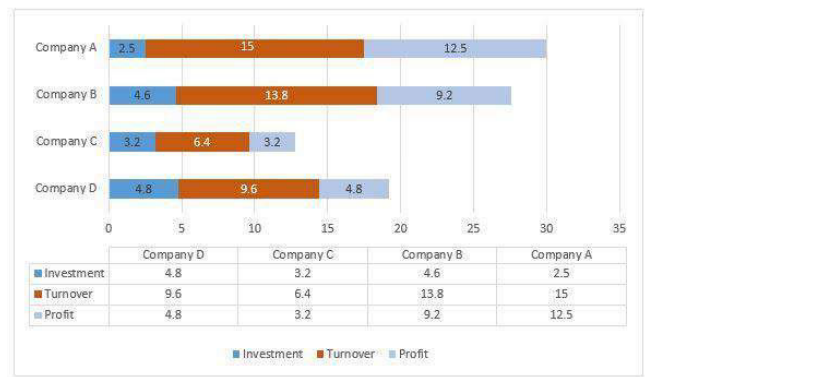
Study the following Bar-chart and the data provided to answer the questions that follow:
Investment, Turnover and Profit of four different companies A, B, C and D are given. (In Lakhs)
What is the gain percentage of Company C?
Directions:
Study the following Bar-chart and the data provided to answer the questions that follow: Investment, Turnover and Profit of four different companies A, B, C and D are given. (In Lakhs)
What is the gain percentage of Company B?