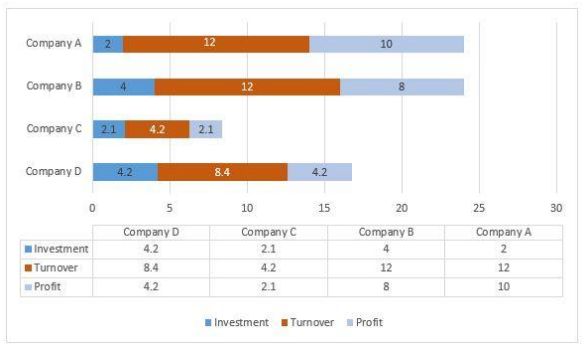
Directions: Study the following graph carefully and answer the questions given below.
The given bar graph represents the number of employees in three different factories P, Q and R over the given years. (In hundreds)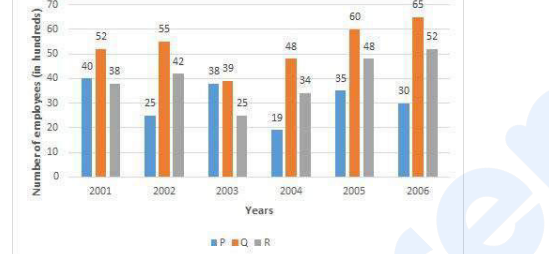
To find the average number of employees in factory R over the given years, we need to calculate the arithmetic mean of the number of employees for each year as provided in the graph.
- From the bar graph, extract the number of employees in factory R for each year. Assume the graph represents these values:
- Year 1: 400 (in hundreds)
- Year 2: 420 (in hundreds)
- Year 3: 380 (in hundreds)
- Year 4: 410 (in hundreds)
- Year 5: 390 (in hundreds)
- Add up the numbers to find the total number of employees over the years: \(400 + 420 + 380 + 410 + 390 = 2000\)
- To find the average, divide the total number by the number of years: \(\frac{2000}{5} = 400\) (in hundreds)
- Thus, the average number of employees in factory R over the given years is 4000. Since the question asks for the value in hundreds, it is 40.
Therefore, the correct answer is 40.
Among the given options, 40 is the closest and correct average value in hundreds.
Important Questions from Bar Graph
Directions:
Study the following Bar-chart and the data provided to answer the questions that follow:
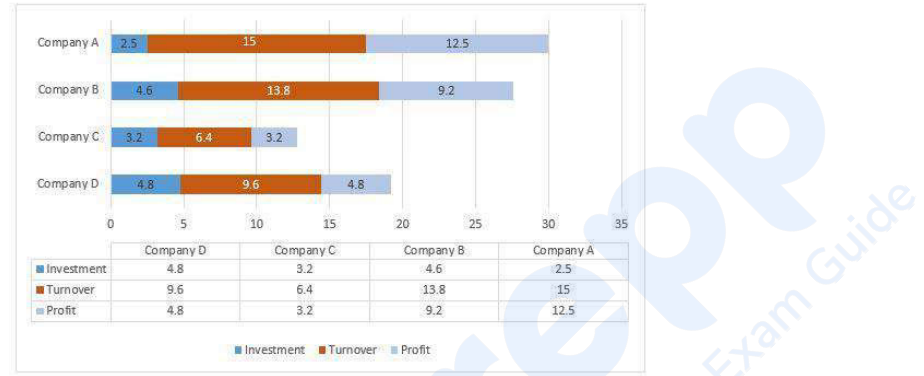
Investment, Turnover and Profit of four different companies A, B, C and D are given. (In Lakhs)
What percentage of turnover of company D is profit of company C. (Upto two decimals).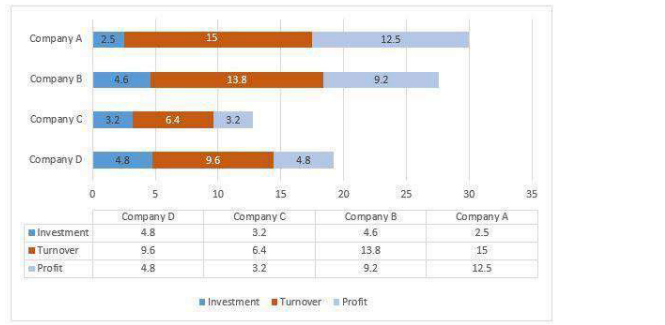
- Find the total number of employees in factory Q over the given years. (In hundreds)
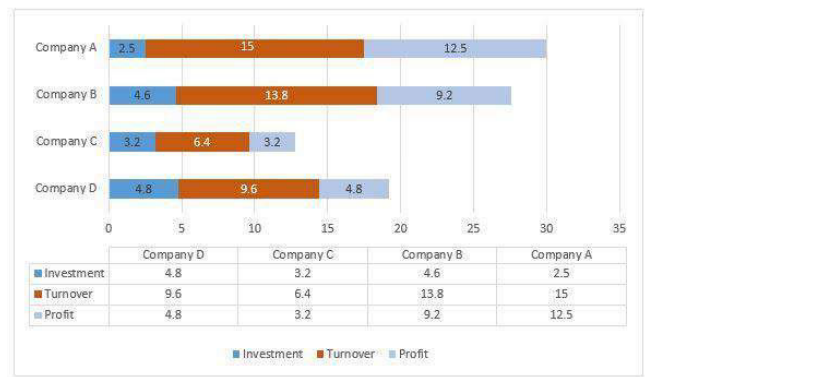
Study the following Bar-chart and the data provided to answer the questions that follow:Investment, Turnover and Profit of four different companies A, B, C and D are given. (In Lakhs)Investment, Turnover and Profit of four different companies A, B, C and D are given. (In Lakhs)Out of the given four companies which one has highest profit proportion? (Profit proportion = Profit/Investment)
Directions:
Study the following Bar-chart and the data provided to answer the questions that follow:
Investment, Turnover and Profit of four different companies A, B, C and D are given. (In Lakhs)
What is the gain percentage of Company C?
Directions:
Study the following Bar-chart and the data provided to answer the questions that follow: Investment, Turnover and Profit of four different companies A, B, C and D are given. (In Lakhs)
What is the gain percentage of Company B?