
The data taken from the publication "sankhya" will be considered as:
secondary data
Understanding Data Types: Primary vs. Secondary Data
In statistics and research, data is broadly classified into two main types based on the method of collection:
- Primary Data: This is data collected directly by the researcher for their specific study. It is original data gathered for the first time. Methods include surveys, interviews, experiments, direct observations, etc.
- Secondary Data: This is data that has already been collected and compiled by someone else and is available from published or unpublished sources. The researcher uses this existing data for their own analysis. Sources include government publications, reports, journals, books, websites, etc.
Analyzing Data from a Publication like "Sankhya"
The question asks about data taken from the publication "Sankhya". A publication is a source where data that has already been collected and processed is presented. The individuals or organization publishing "Sankhya" are the primary collectors or compilers of that data.
When a researcher obtains data from such a publication, they are not collecting the data themselves directly from the original source (like individuals, companies, etc.). Instead, they are using data that has already been processed and published by another entity.
Therefore, data obtained from a publication falls under the category of secondary data.
| Feature | Primary Data | Secondary Data |
|---|---|---|
| Originality | Original, collected for the first time | Already exists, collected previously |
| Source | Collected directly from source (e.g., individuals, experiments) | Obtained from existing publications or records |
| Collection Cost/Time | Usually higher (requires planning, field work) | Usually lower (data is readily available) |
| Specificity | Collected to meet specific research needs | May not perfectly fit the research needs, may require adjustments |
| Reliability/Accuracy | Researcher controls data quality (potential for bias exists) | Reliability depends on the original source and how it was collected/published |
| Example | Conducting a new survey on consumer preferences | Analyzing sales figures from a company's annual report |
Based on the definitions and comparison, data taken from a publication like "Sankhya" is secondary data because it is not collected directly by the researcher but is obtained from an existing published source.
Revision Table: Key Data Concepts
| Concept | Description | Type of Data |
|---|---|---|
| Data from a survey conducted by *you* | You collected it for your study. | Primary Data |
| Sales data from a government census report | The government collected and published it. You are using their report. | Secondary Data |
| Results from an experiment *you* performed | You designed and executed the experiment. | Primary Data |
| Information from a research paper or journal like "Sankhya" | Another researcher or organization collected and published it. You are using their published work. | Secondary Data |
Additional Information: Sources of Secondary Data
Secondary data can be obtained from various sources. These sources can be broadly categorized:
- Internal Sources: Data available within the organization itself, such as sales records, financial statements, customer databases, employee records.
- External Sources: Data available outside the organization. These include:
- Government publications (census data, economic surveys, statistical reports).
- Non-government publications (research reports, journals, books, magazines).
- Syndicated services (data collected and sold by research firms).
- Databases (online or offline).
- Websites and social media.
- Archives and historical documents.
Using secondary data can save time and resources, but it's important to evaluate the reliability, relevance, and accuracy of the source.
Similar Questions
Suppose in a certain large group, the height is approximately normally distributed with a mean of 160 cm and the standard deviation is 10. For a sample of size 16, the sampling distribution of sample mean has standard error equal to:
Which of the following is NOT an example of the probability sampling technique?
A completely randomised design is based on the principles of ______ and randomisation only.
A sample of 30 latest returns on UTI stock reveals a mean return of $4 with a sample standard deviation of $0.13. The estimated standard error of the sample mean is:
In a cluster sampling wherein the units within same cluster are highly correlated, suppose \(S_w^2\) represents the variance within the clusters and \(S_b^2\) between clusters, then which option is correct?
In some of the real-life situations, a researcher has to explore two or more treatments at the same time. This type of experimental design is referred to as:
In the construction of cost of living index, commodities are selected by:
If 4, 5, 6, 6, 6, 6, 6, 6, 6, 7 be a random sample from a Poisson population with parameter λ, then an unbiased estimate of λ is:
Important Questions from Sampling Theorems
Four red balls, four green balls and four blue balls are put in a box. Three balls are pulled out of the box at random one after another without replacement. The probability that all the three balls are red is
Three cards were drawn from a pack of 52 cards. The probability that they are a king, a queen, and a jack is
A population (with mean $\mu$) follows normal distribution. Ten samples (N) are drawn at random with a mean value of “x” and standard deviation of “S”. Following table provides the confidence limits, C(t) of the cumulative probability function for Student's t - distribution two-tailed test with degree of freedom, D.
C(t)
D 0.9 0.95 0.975 9 1.38 1.83 2.26 10 1.37 1.81 2.23 11 1.36 1.80 2.20 Which one of the following expression is correct for testing the null hypothesis $H_0: \mu = 0$ at $10\%$ significance level?
- If the sample size ($n$) is 25 and the standard deviation ($\sigma$) of population is 2, then the standard error (SE) of sample mean, (rounded off to one decimal place), is ________.
The probability distribution function of a random variable $X$ is shown in the following figure.
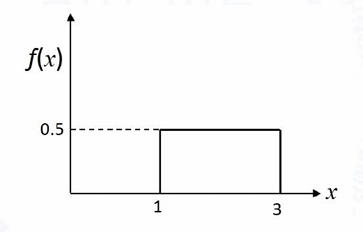
From this distribution, random samples with sample size $n = 68$ are taken. If $\bar{X}$ is the sample mean, the standard deviation of the probability distribution of $\bar{X}$, i.e. $\sigma_{\bar{X}}$ is ________ (round off to 3 decimal places).



