Understanding the $^1H$ NMR Spectrum
The $^1H$ NMR spectrum reveals information about hydrogen nuclei. Key parameters are chemical shift ($\delta$), indicating the electronic environment, and integration, representing the relative number of protons.
- Ethyl Iodide ($CH_3CH_2I$): Contains two distinct proton types: a $CH_3$ group (3 protons) and a $CH_2$ group (2 protons).
- Bromoform ($CHBr_3$): Contains a single proton ($CH$) attached to a carbon atom bonded to three bromine atoms.
Assigning Observed Signals
The provided spectrum shows three signals with integrations 1, 3, and 4.5 at $\delta$ 6.80, 3.20, and 1.85 ppm, respectively.
- The signal at $\delta$ 6.80 ppm with integration 1 is assigned to the single proton of bromoform ($CHBr_3$), as it's a singlet and corresponds to 1 proton.
- The remaining signals, $\delta$ 3.20 ppm (integration 3) and $\delta$ 1.85 ppm (integration 4.5), must originate from the protons of ethyl iodide ($CH_3CH_2I$).
Proportionality Check for Ethyl Iodide
Ethyl iodide has 3 protons in the $CH_3$ group and 2 protons in the $CH_2$ group, a ratio of $3:2$. The observed integrations for these signals are 4.5 and 3.
The ratio of observed integrations is $4.5 : 3$. This ratio simplifies to $1.5 : 1$.
To check consistency, we compare the observed ratio of integrations for ethyl iodide ($4.5:3$) with the expected ratio of protons ($3:2$). If the signal with integration 3 represents the $CH_2$ group (2 protons) and the signal with integration 4.5 represents the $CH_3$ group (3 protons), the proportionality holds because $\frac{4.5}{3} = 1.5$ and $\frac{3}{2} = 1.5$.
Calculating the Molar Ratio
Signal integration is proportional to the product of the number of moles and the number of protons per molecule.
- Bromoform ($CHBr_3$): Has 1 proton. The integration is 1. Let the number of moles be $n_{BF}$. The signal intensity is proportional to $n_{BF} \times 1$. Thus, $n_{BF} \propto 1$.
- Ethyl Iodide ($CH_3CH_2I$): Has a total of 5 protons ($3$ in $CH_3$ and $2$ in $CH_2$). The total observed integration for ethyl iodide is $4.5 + 3 = 7.5$. Let the number of moles be $n_{EI}$. The total signal intensity is proportional to $n_{EI} \times 5$. Thus, $n_{EI} \times 5 \propto 7.5$.
From the ethyl iodide data, we derive the relative moles: $n_{EI} \propto \frac{7.5}{5} = 1.5$.
From the bromoform data, we have $n_{BF} \propto 1$.
The molar ratio of ethyl iodide to bromoform ($n_{EI} : n_{BF}$) is therefore $1.5 : 1$.
Important Questions from Nmr
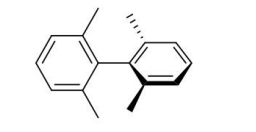
The number of signals observed in the proton decoupled $^{13}\text{C}$ NMR spectrum of the following compound is
The organic compound that displays following data is
$^1\text{H}$ NMR ($400\text{ MHz}$): $\delta \ 7.38\text{ (d)}, \ 7.25\text{ (d)}, \ 1.29\text{ (s) ppm}$
The correct match of the circled protons in Column $\text{P}$ with the $^1\text{H}$ NMR chemical shift ($\delta\text{ ppm}$) in Column $\text{Q}$ is
P Q I 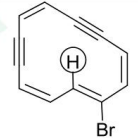
A 6.72 II 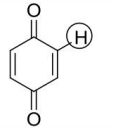
B 16.4 III 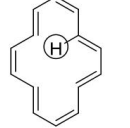
C -0.61 - The ${}^{31}\text{P}\{^1\text{H}\}$ NMR spectrum of $2,2,6,6-\text{N}_4\text{P}_4\text{Cl}_4(\text{NMe}_2)_4$ is expected to show
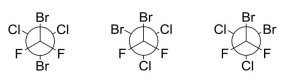
Number of lines in the $^{19}F$ NMR spectrum of $F_2C(Br)-C(Br)Cl_2$ at -120 $^\circ C$ assuming it a mixture of static conformations given below, are