
ClF3 Structure and Fluorine Environments
The molecule Chlorine trifluoride ($ClF_3$) adopts a T-shaped molecular geometry based on VSEPR theory.
In this structure, the three fluorine atoms occupy distinct positions relative to the central chlorine atom:
- Two Axial Fluorines (Fax): These are equivalent due to symmetry.
- One Equatorial Fluorine (Feq): This fluorine atom is in a unique position.
At low temperatures (like $-60 \text{ } ^\circ C$), molecular rotation is hindered, making these different fluorine environments observable in the NMR spectrum.
Predicting $^{19}F$ NMR Splitting Patterns
Nuclear Magnetic Resonance ($^{19}F$ NMR) spectroscopy detects signals from fluorine nuclei. The splitting of these signals (multiplets) arises from spin-spin coupling with neighboring NMR-active nuclei, following the $n+1$ rule, where '$n$' is the number of equivalent neighboring spins.
- Equatorial Fluorine (Feq) Signal: The single Feq atom couples with the two equivalent axial fluorines (Fax). Each Fax has a nuclear spin of $I = 1/2$. The two Fax nuclei together result in spin states giving a 1:2:1 intensity ratio. Therefore, the Feq signal is split into a triplet.
- Axial Fluorines (Fax) Signal: Each of the two equivalent Fax atoms couples with the unique equatorial fluorine (Feq), which has a spin of $I = 1/2$. This coupling splits the signal into a doublet.
Observed Spectrum
Combining these predictions, the $^{19}F$ NMR spectrum of $ClF_3$ at $-60 \text{ } ^\circ C$ will show two distinct sets of signals:
- A set of signals corresponding to the axial fluorines, appearing as a doublet.
- A signal corresponding to the equatorial fluorine, appearing as a triplet.
Thus, the spectrum is observed as a doublet and a triplet.
Important Questions from NMR Spectroscopy (1H and 13C)
In the $^1H$-NMR spectrum of the following molecule, the signal of proton $H_a$ appears as

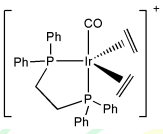
The $^1H$ NMR spectrum of the given iridium complex at room temperature gave a single signal at 2.6 ppm, and its $^{31}P$ NMR spectrum gave a single signal at 23.0 ppm. When the spectra were recorded at lower temperatures, both these signals split into a complex pattern. The intra-molecular dynamic processes shown by this molecule are
Compound K displayed a strong band at $1680 \text{ cm}^{-1}$ in its IR spectrum. Its $^1H$-NMR spectral data are as follows: $\delta$ (ppm) 7.30 (d, J = 7.2 Hz, 2H), 6.8 (d, J = 7.2 Hz, 2H), 3.8 (septet, J = 7.0 Hz, 1H), 2.2 (s, 3H), 1.9 (d, J = 7.0 Hz, 6H). The correct structure of compound K is
$^1H$ NMR spectrum of a mixture containing $CH_3Br$ ($x$ mol) and $(CH_3)_3CBr$ ($y$ mol) shows two singlets at 2.7 ppm and 1.8 ppm, with the relative ratio of 3:1 (integration value), respectively. The value of $x/y$ is ____________
(rounded off to the nearest integer)Consider the following $^1H$-NMR ($400$ MHz, DMSO-$d_6$) data of a compound:
$\delta$ in ppm: $3.85$ (s, $6H$), $6.73$ (t, $J = 2.2$ Hz, $1H$), $7.1$ (d, $J = 2.2$ Hz, $2H$), and $13.05$ (brs, $1H$).
The compound is


