
Study the given chart and answer the question that follows. The chart shows the quantities of machines (M1, M2, M3) available in different stores (S1, S2, S3, S4).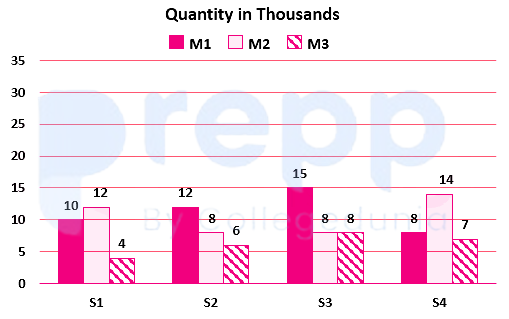
Which stores have more number of M2 machines than the average number of M2 machines per store?
S1 and S4
Calculation:
Total M2 in 4 stores = 14 + 8 + 8 + 12
⇒ 42
Average M2 in 4 stores = 42/4
⇒ 10.5
So, in S1 and S4 has more than average of M2 per store
∴ The correct answer is Option 4.
Similar Questions
Which country has the second largest population density?
For the second show the number of audience in Screen 3 is how much more than the number of audience in Screen 1?
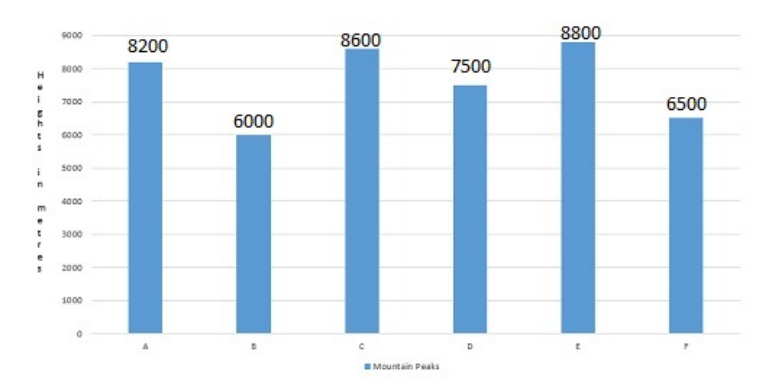
A bar graph showing the heights of six mountain peaks. Study the bar graph and answer questions. The average height of all the peaks (in meters) is:
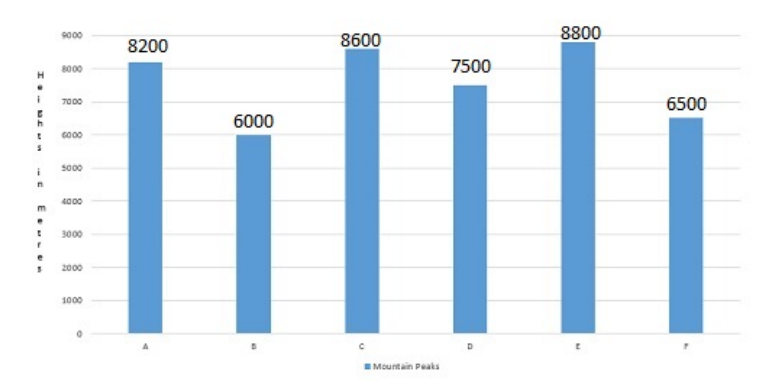
A bar graph showing the heights of six mountain peaks. Which peak is the second highest?
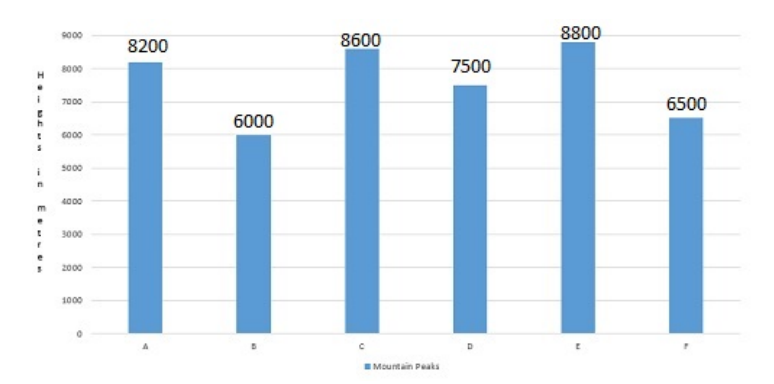
A bar graph showing the heights of six mountain peaks. Write the ratio of the heights of the highest peak and the lowest peak:
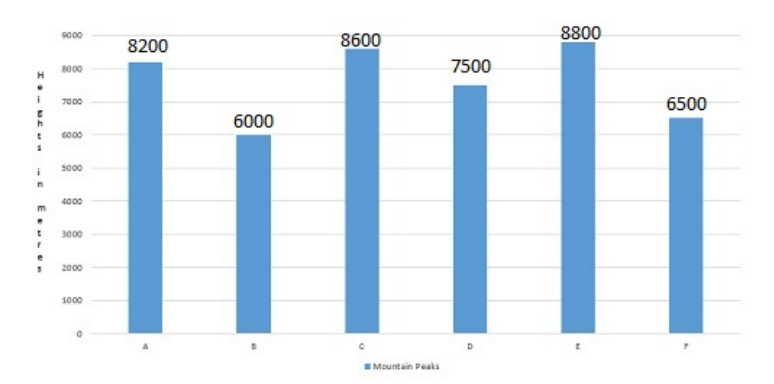
A bar graph showing the heights of six mountain peaks. When the heights of the given peaks are written in ascending order, what is the average of the middle two peaks?
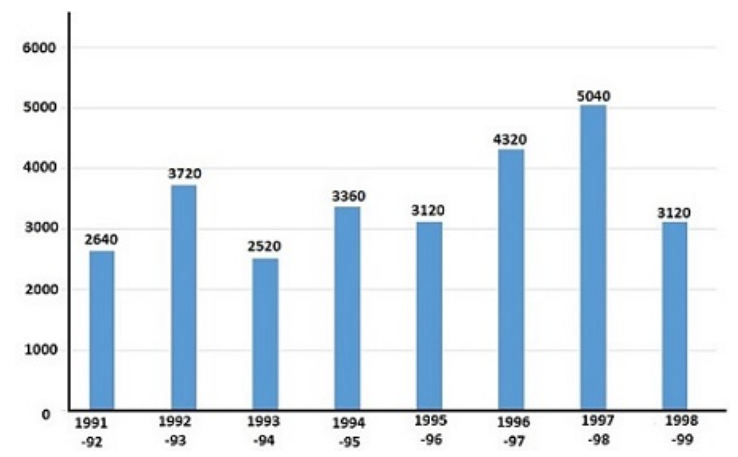
Study the following bar-diagram carefully and answer the questions. The bar graph given below shows the foreign exchange reserves of a country (in million US $) from 1991 - 1992 to 1998 - 1999.
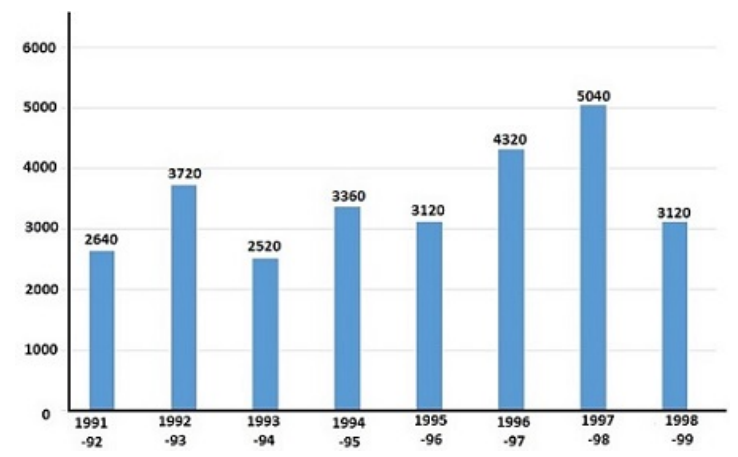
The foreign exchange reserves in 1996-97 were approximately what percent of the average foreign exchange reserves over the period under review?
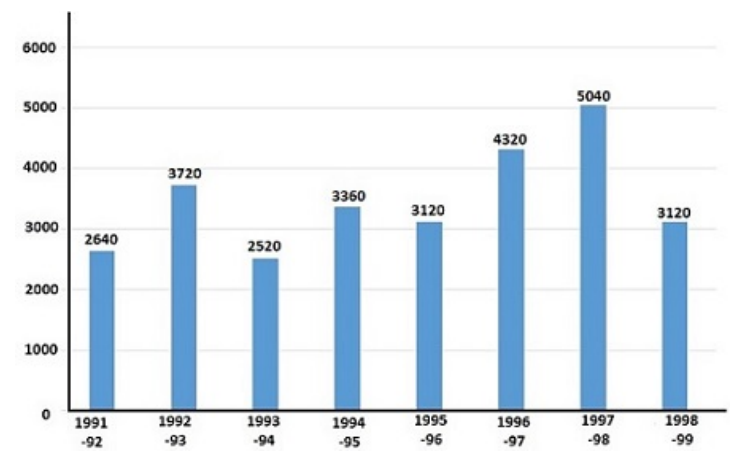
The percentage increase in the foreign exchange reserves in 1997-98 over 1993-94 is
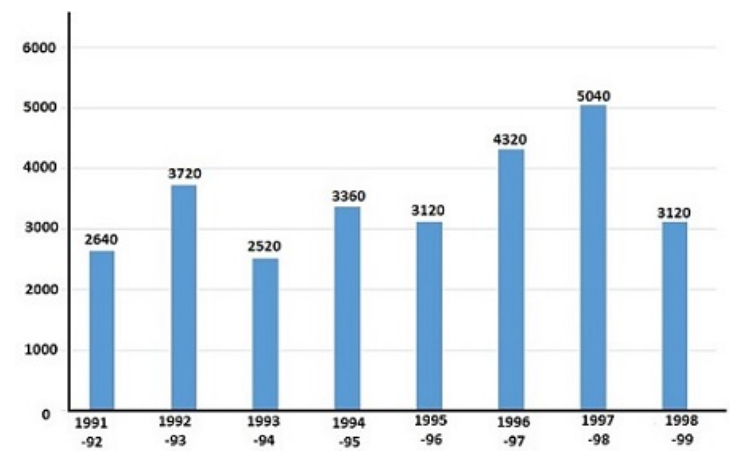
The ratio of the sum of foreign exchange during the years 1991-92, 1992-93, 1993-94 to that during the years 1995-96, 1996-97, 1997-98 is
Important Questions from Bar Graph
Sales of books from four shops (B1, B2, B3, B4) in thousands are given as below. Study the graph and answer the following questions.
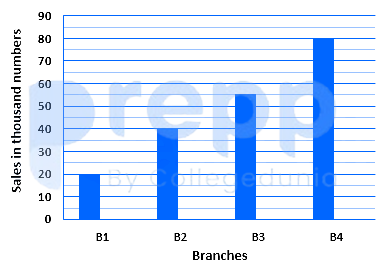
If each shop can increases the sales of books by 10%,then the total number of books(in thousands) soldby all the shop are:
The given pie chart shows the degree-wise break-up of the expenditure of a family in a month. The total expenditure of the family is ₹43,200.
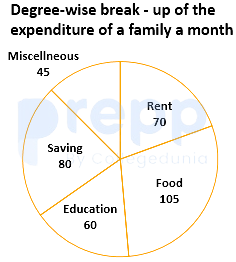
By what percentage is the expenditure on education and rent taken together more than the expenditure on food (correct to two decimal places)?
Which country has the second largest population density?
For the second show the number of audience in Screen 3 is how much more than the number of audience in Screen 1?
In which year the percentage increase in production as compared to the previous year was the maximum?



