
A bar graph showing the heights of six mountain peaks. When the heights of the given peaks are written in ascending order, what is the average of the middle two peaks?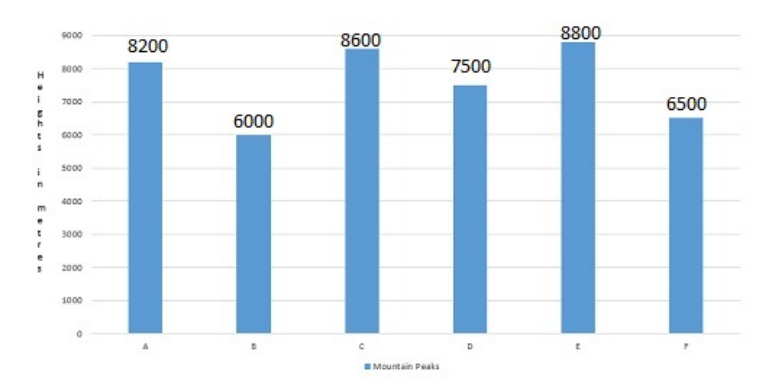
7850 m
The bar graph displays the heights of six mountain peaks. To find the average of the middle two peaks when the heights are arranged in ascending order, we first need to arrange the given heights in ascending order.
From the bar graph, we can see the heights are approximately:
- Peak A: 7200 m
- Peak B: 8100 m
- Peak C: 7500 m
- Peak D: 8500 m
- Peak E: 7900 m
- Peak F: 7700 m
Arranging these heights in ascending order, we get:
- 7200 m
- 7500 m
- 7700 m
- 7900 m
- 8100 m
- 8500 m
The middle two peaks are 7700 m and 7900 m. To find their average, we sum them and divide by 2:
\(\frac{7700 + 7900}{2} = \frac{15600}{2} = 7800\)
The closest option to 7800m is 7850m. Note that the values read from the graph are approximate; slight variations in reading the bar graph might lead to a slightly different answer. The provided answer is an approximation based on visual interpretation of the graph.
Similar Questions
Which country has the second largest population density?
For the second show the number of audience in Screen 3 is how much more than the number of audience in Screen 1?
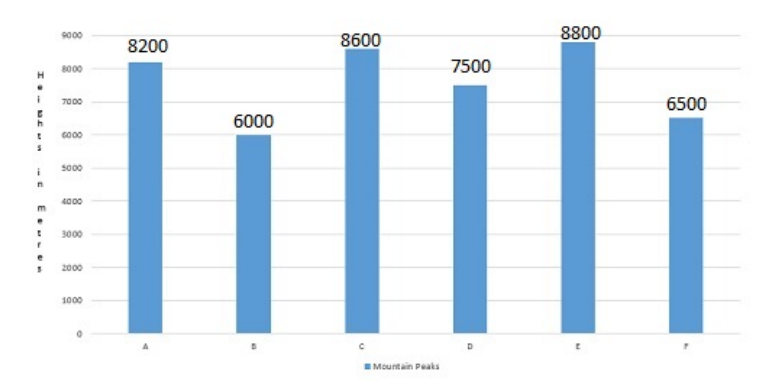
A bar graph showing the heights of six mountain peaks. Study the bar graph and answer questions. The average height of all the peaks (in meters) is:
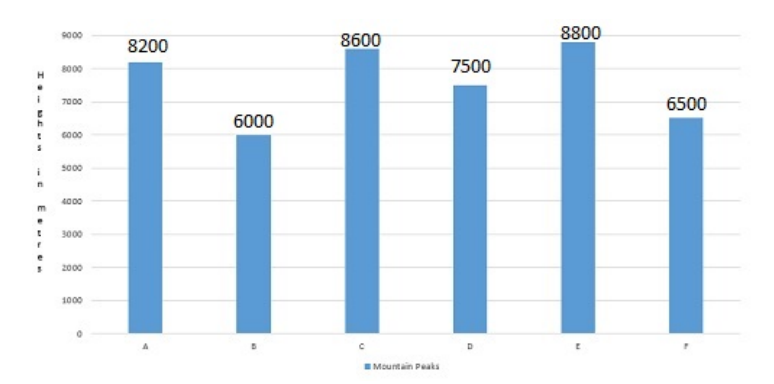
A bar graph showing the heights of six mountain peaks. Which peak is the second highest?
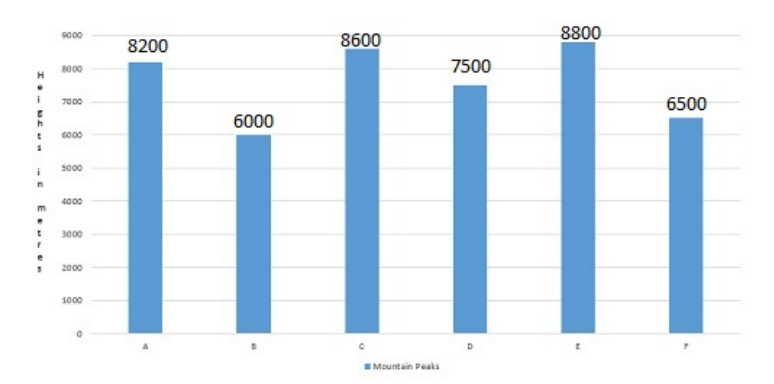
A bar graph showing the heights of six mountain peaks. Write the ratio of the heights of the highest peak and the lowest peak:
The following figure shows the number of students (in thousands) admitted and passed out per year in a college during years 2000 to 2004. Study the figure and answer the questions.
The percent increase in the number of students admitted in the year 2003 over that in 2001 is:
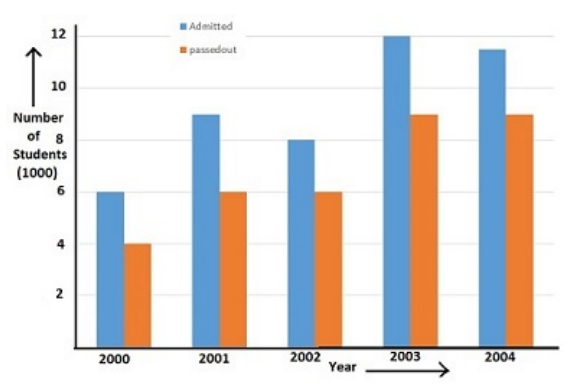
The following figure shows the number of students (in thousands) admitted and passed out per year in a college during years 2000 to 2004. Study the figure and answer the questions.
During 2000 to 2003, the ratio of the total number of students passed out to the total number of students admitted is:
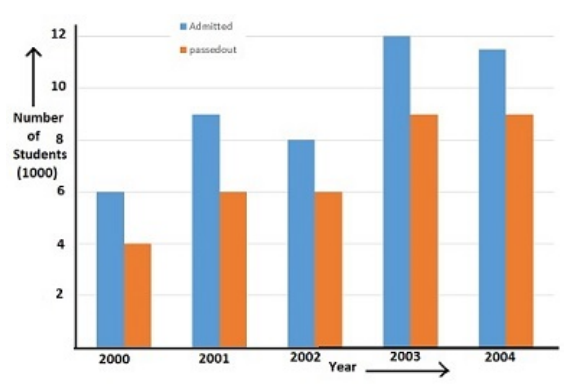
The following figure shows the number of students (in thousands) admitted and passed out per year in a college during years 2000 to 2004. Study the figure and answer the questions.
In which of the two years, the pass percentage of students was between 60 to 70%?
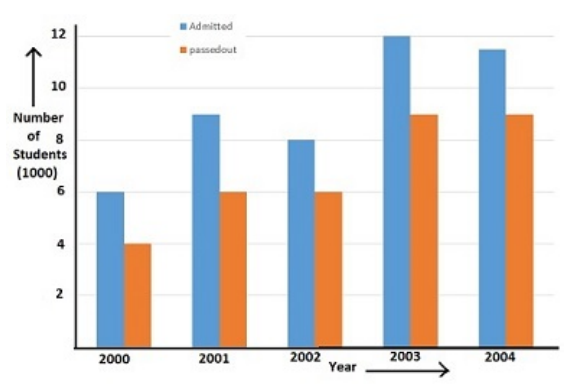
The following figure shows the number of students (in thousands) admitted and passed out per year in a college during years 2000 to 2004. Study the figure and answer the questions.
The ratio of the number of students admitted in the year 2002 to the average of the number of students passed out in the years 2003 and 2004 is:
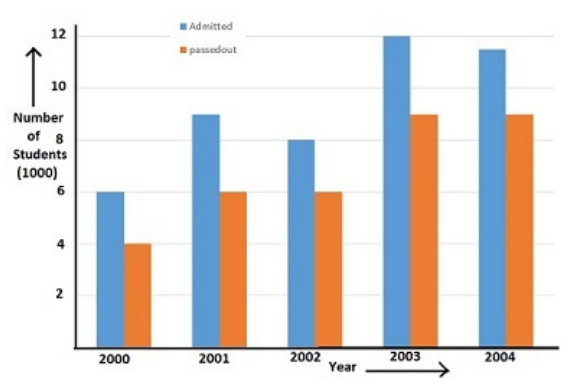
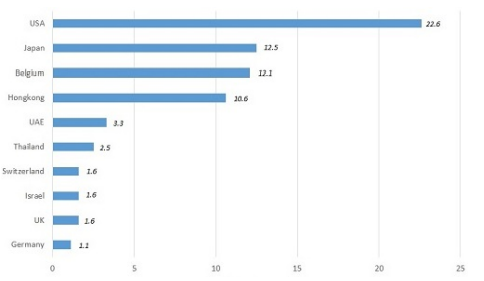
Study the bar diagram carefully and answer the following questions. Export (in Billion Rupees) of gems and jewellery in the year 1991-1992 is given.
The ratio of the sum of the exports to the bottom six countries to the total exports to all the given countries in 1991-1992 is approximately:
Important Questions from Bar Graph
Sales of books from four shops (B1, B2, B3, B4) in thousands are given as below. Study the graph and answer the following questions.
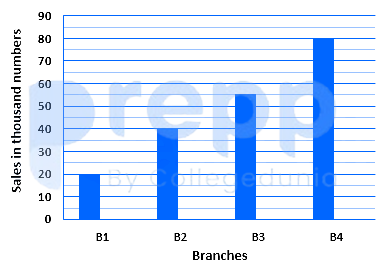
If each shop can increases the sales of books by 10%,then the total number of books(in thousands) soldby all the shop are:
The given pie chart shows the degree-wise break-up of the expenditure of a family in a month. The total expenditure of the family is ₹43,200.
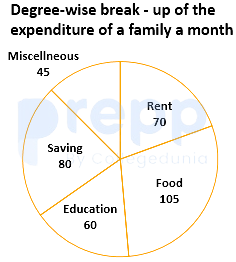
By what percentage is the expenditure on education and rent taken together more than the expenditure on food (correct to two decimal places)?
Which country has the second largest population density?
For the second show the number of audience in Screen 3 is how much more than the number of audience in Screen 1?
The percentage increase in the total production of cars from 2014 to 2018 was



