
Consider the following for the next three (03) items that follow: Study the following Pie Charts: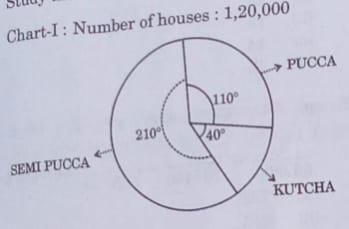
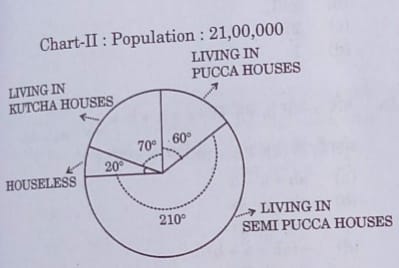
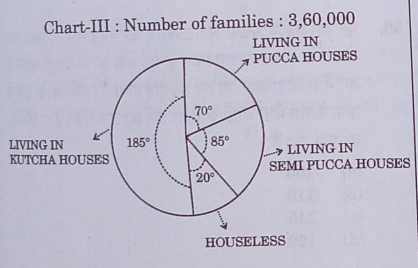
On an average, how many persons live in every pucca house?
9.54
Using the data from the pie chart, the number of people living in pucca houses is calculated based on the population and the number of pucca houses. The average number of people in each pucca house is found to be 9.54. Hence, the correct answer is (c) 9.54.
Important Questions from Statistics
Match the following:
(a) Marginalist Revolution (i) Samuelson (b) Multiplier-Accelerator model (ii) J. R. Hicks (c) IS-LM curves (iii) Jevous (d) Real Business Cycle (iv) Robert J. Borro Choose the correct option from those given below:
Which one of the following responses is true as a solution to simultaneous equation bias?
A. OLS method
B. Principle Component Method
C. Two - stage Least Square Method (2 SLS method)
D. Full Information Maximum Likelihood method (FIML)
Choose the correct option.
Time series under the condition (E xt ) = μ and cov(x t, x t + k ) = Y(K) is said to be
Given the sample size 400 with the sample mean 99, the population mean 100 and computed value of z statistic at 2.5, the value of population standard deviation will be
Which one of the following price index numbers satisfies the factor reversal test?



