The below graph shows the results of boys and girls in different standards.
Study the graph and answer the question that follows.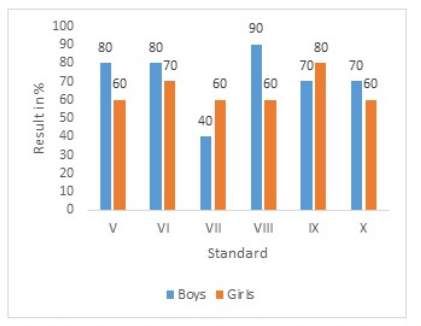
In which standard is the ratio of boys' performance to girls' performance 3 : 2?
The question asks in which standard the ratio of boys' performance to girls' performance is 3:2. According to the information provided, we need to examine the graph that illustrates the performance of boys and girls in various standards.
Let's go through the steps to determine the ratio for each standard based on the graph.
- Identify the data points on the graph corresponding to the performance of boys and girls in the different standards.
- For each standard (VI, VII, VIII, IX), note the performance scores of boys and girls.
- Calculate the ratio of boys' performance to girls' performance for each standard:
- Standard VI: Suppose Boys = \(B_{VI}\), Girls = \(G_{VI}\). Calculate the ratio as \(\frac{B_{VI}}{G_{VI}}\).
- Standard VII: Suppose Boys = \(B_{VII}\), Girls = \(G_{VII}\). Calculate the ratio as \(\frac{B_{VII}}{G_{VII}}\).
- Standard VIII: Suppose Boys = \(B_{VIII}\), Girls = \(G_{VIII}\). Calculate the ratio as \(\frac{B_{VIII}}{G_{VIII}}\).
- Standard IX: Suppose Boys = \(B_{IX}\), Girls = \(G_{IX}\). Calculate the ratio as \(\frac{B_{IX}}{G_{IX}}\).
- Compare each calculated ratio and identify where it matches 3:2, or in fractional form \(\frac{3}{2}\).
Upon performing the ratio calculations for each standard, we determine that:
- Standard VIII has the ratio of boys' performance to girls' performance equal to 3:2.
Therefore, the standard where the ratio of boys' performance to girls' performance is 3:2 is VIII. Hence, the correct answer is Option VIII.
Similar Questions
The given bar graph shows the total number of wireless keyboards (in thousands) produced by five different branches of a company, B1, B2, B3, B4 and B5, in 2015 and 2016. Study the graph and answer the following question.
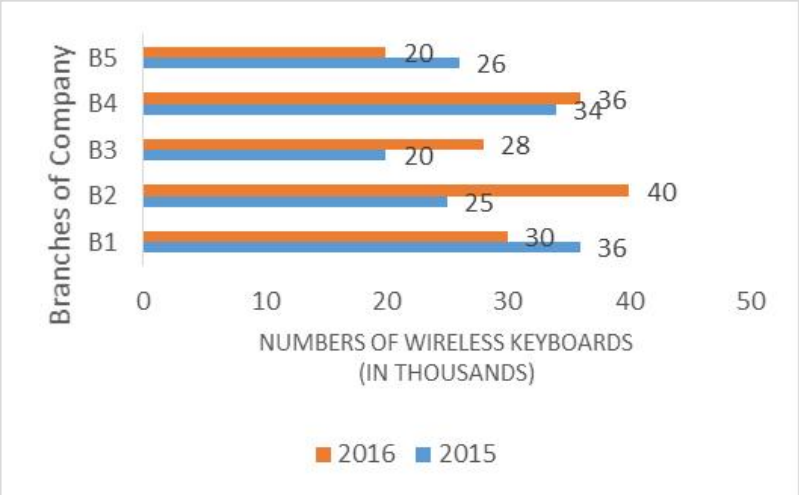
The number of wireless keyboards produced by branch B4 in 2016 is equal to that produced by which branch in 2015?
The given bar graph shows the sales of inverters of five different shops, A, B, C, D and E, in the years 2017 and 2018.
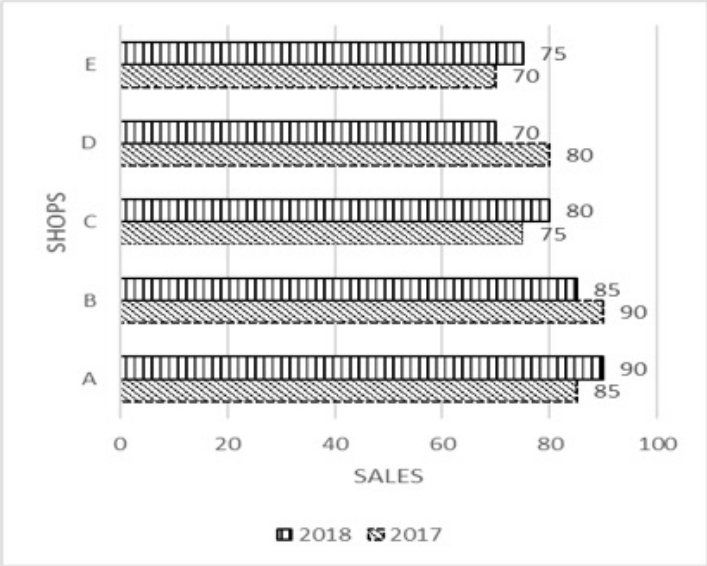
What is the ratio of the total sales of shop A for both the years to that of shop D for both the years?
The given bar graph shows the total number of air conditioners (ACs) of different brands, P, L, S, E and H (in thousand numbers) sold by a supplier in 2018 and 2019. Study the graph carefully and answer the following question.
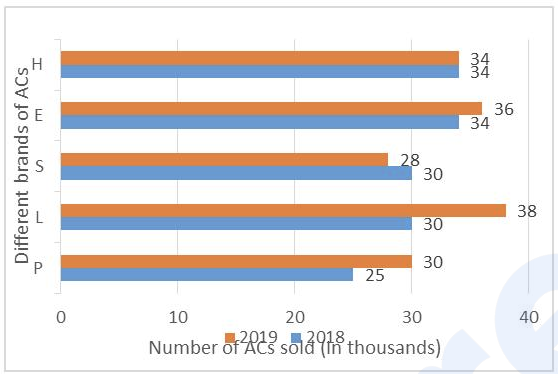
For which of the following pairs of brands was the total number of ACs sold in 2018 and 2019 together equal?The given bar graph shows the data of the production of XYZ automobiles (in thousand numbers) by three branches, A, B and C of, a company over 5 years (2012-2016)).
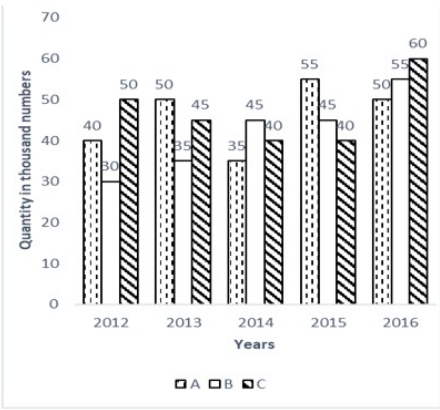
Which branch has recorded the highest percentage growth in production of XYZ automobiles in the given period?In which year was the value per unit ₹250?
If in 2017, the items were sold at the same rate as in 2016, then what would be the value of sale in 2017?
Across all the given standards, what is the difference in overall average percentage in marks between boys and girls?
The given bar graph shows the profit made by a software company (in $ million) over 5 years (from 2012 to 2018). Answer the question given below based on the bar graph.
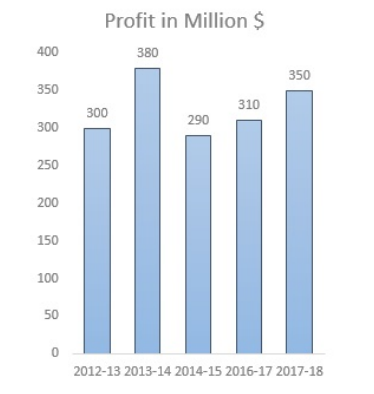
What was the percentage increase in the profit made by the software company in 2013-14 over 2012-13?The given bar graph shows the production of drones (in lakhs) by three companies X, Y and Z over 6 years (from 2012 to 2017). Answer the question given below based on the bar graph.
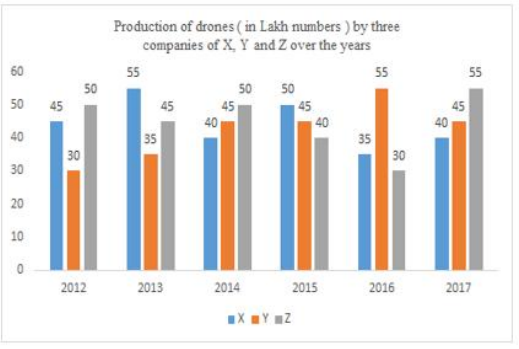
What is the ratio of the average production of company X in the period 2014-2016 to the average production of company Y in the same period?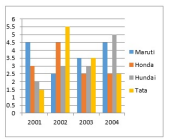
The given bar chart shows production of cars by different manufacturers from year 2001 to 2004. All values are in thousands.
What was the total production of cars in thousands from 2001 to 2004?
Important Questions from Bar Graph
Sales of books from four shops (B1, B2, B3, B4) in thousands are given as below. Study the graph and answer the following questions.
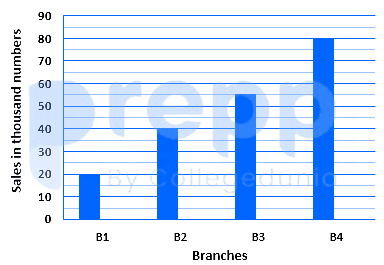
If each shop can increases the sales of books by 10%,then the total number of books(in thousands) soldby all the shop are:
The given pie chart shows the degree-wise break-up of the expenditure of a family in a month. The total expenditure of the family is ₹43,200.
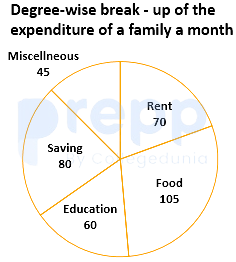
By what percentage is the expenditure on education and rent taken together more than the expenditure on food (correct to two decimal places)?
Which country has the second largest population density?
For the second show the number of audience in Screen 3 is how much more than the number of audience in Screen 1?
The percentage increase in the total production of cars from 2014 to 2018 was