In a survey of 200 candidates, 70 prefer Coffee, 80 prefer Tea, and 90 prefer Milk. 30 candidates prefer both Coffee and Tea, 40 prefer both Tea and Milk, and 50 prefer both Coffee and Milk. If 20 candidates prefer all three, how many candidates prefer NONE of the three beverages?
60
Let C, T and M be the sets preferring Coffee, Tea and Milk.
By inclusion–exclusion: \(n(C \cup T \cup M) = n(C)+n(T)+n(M) - n(C \cap T) - n(T \cap M) - n(C \cap M) + n(C \cap T \cap M)\)
\(= 70 + 80 + 90 - 30 - 40 - 50 + 20 = 140\)
So 140 candidates prefer at least one beverage.
Candidates preferring none = 200 − 140 = 60.
Hence, the answer is 60.
Similar Questions
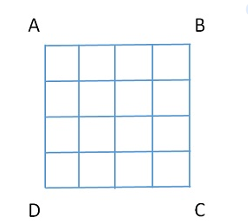
How many squares are there in the square figure ABCD?
Identify the diagram that best represents the relationship among classes given below: Universe, Stars, Sun
Which of the following diagram represents the relationship among Tall men, Black haired, Indians?
Identify the diagram that best represents the relationship among classes given below: Men, Rodents and living beings
In a village some of the goldsmiths are literates. Which diagram shows literate goldsmiths?
Identify the diagram that best represents the relationship among classes given below
Minutes, Days, Months.
Consider the given statement/s to be true and decide which of the given conclusions/assumptions can definitely be drawn from the given statement.
Statement:
I. Nutritious food is delicious and good for health
II. Honey is nutritious.
Conclusions:
I. Honey is good for health.
II. Delicious foods are nutritious.
Identify the diagram that best represents the relationship among classes given below: North America, United States of America, New York.
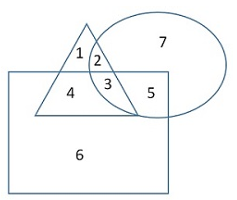
In the given figure, triangle represents the healthy, square represents the old, and circle represents the men. Find out the area of the figure which represents the “men who are healthy but not old”.
Which of the answer figures best represents the relation between: Shirt, Garments, Clothes
Important Questions from Venn Diagram
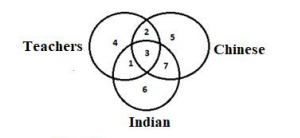
Study the diagram and identify the region representing teachers who are Chinese but not Indian.
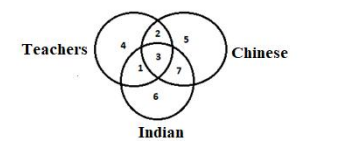
Study the diagram and identify the region representing teachers who are Indian and Chinese.
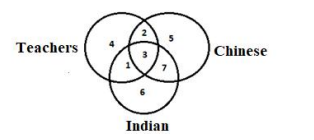
Study the diagram and identify the region representing teachers who are Indian but not Chinese.
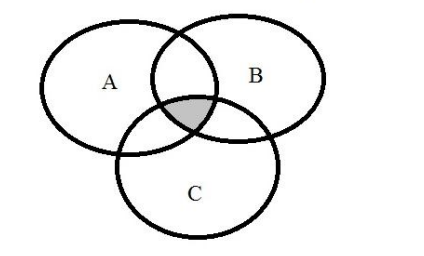
In the following diagram, A contains all the people who like chocolate, B contains all the people who like ice-cream and C contains all the people who like candy. What does the shaded area represent?
- Select the Venn diagram that best represents the relationship between the following classes.
Ant, Insect, Fox, Mammal