Study the diagram and identify the region representing teachers who are Indian and Chinese.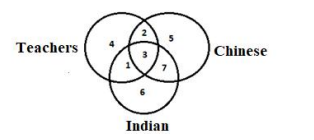
To solve this problem, we need to analyze the Venn diagram provided, which shows the relationship between three categories: Teachers, Chinese, and Indian.
Our task is to identify the region that represents teachers who are both Indian and Chinese.
- In the Venn diagram, the circle labeled "Teachers" overlaps with two other circles labeled "Chinese" and "Indian."
- The region where all three categories (Teachers, Chinese, and Indian) overlap is the intersection of the three circles, which is the area labeled with the number 3.
- This region, labeled 3, represents individuals who are simultaneously Teachers, Chinese, and Indian.
- Therefore, the correct answer is the region labeled 3 only.
Let's verify the given options:
- Option 1, 2, 7: Incorrect, as these regions do not include the section where all three characteristics overlap.
- Option 2, 3: Incorrect, as region 2 does not include individuals who are both Indian and Chinese.
- Option 1, 7: Incorrect, as these regions do not pertain to teachers who are both Indian and Chinese.
- Option 3 only: Correct, as explained above, this is the intersection representing Teachers who are both Indian and Chinese.
Thus, the correct answer is 3 only.
Similar Questions
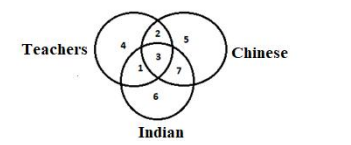
Study the diagram and identify the region representing teachers who are Chinese but not Indian.
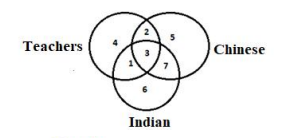
Study the diagram and identify the region representing teachers who are Indian but not Chinese.
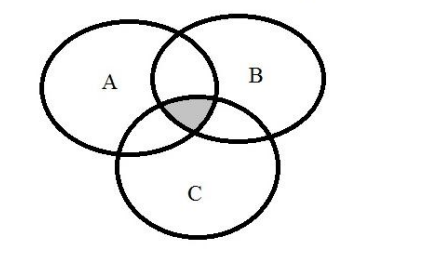
In the following diagram, A contains all the people who like chocolate, B contains all the people who like ice-cream and C contains all the people who like candy. What does the shaded area represent?
- Select the Venn diagram that best represents the relationship between the following classes.
Ant, Insect, Fox, Mammal - Select the Venn diagram that best represents the relationship between the following classes.
Swimming, Cycling, Exercises How many stars are both Tyres and Pen?
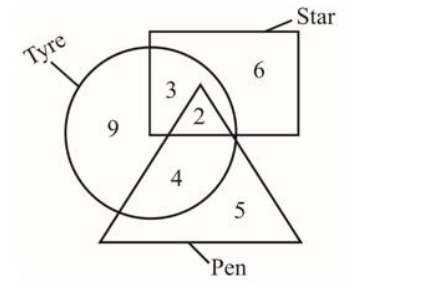
- Select the Venn diagram that best represents the relationship between the following classes.
Guava, Potato, Vegetables - Select the Venn diagram that best represents the relationship between the following classes.
Lawyers, Human Beings, Married People - Select the Venn diagram that best represents the relationship between the following classes.
Rivers, Ganga, Water bodies - Select the Venn diagram that best represents the relationship between the following classes.
Honesty, Banana, Virtue
Important Questions from Venn Diagram
In the following figure, square represents Priests, triangle represents singers, circle represents Therapists and rectangle represents Indians. Which set of of letters represents Indians who are not priests?
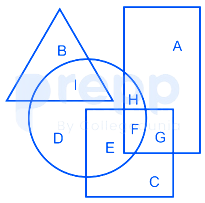
Study the given diagram carefully and answer the question. The numbers in different sections indicate the number of persons.
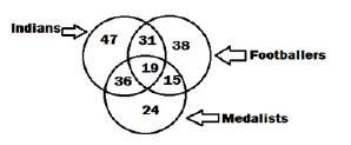
How many such medallists are there who are also Indians?
Study the given diagram carefully and answer the question. The numbers in different sections indicate the number of persons.
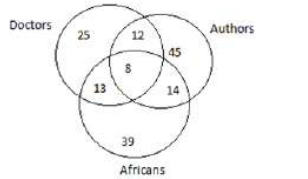
How many Africans are there who are also authors?
Identify the diagram that best represents the relationship among classes given below: Universe, Stars, Sun
Which one of the following diagrams represents the relationship between Insects, Flies and Dogs?