In a school, the total number of students from class VII to X is 1080, as shown in the pie graph . How many students are there in total in class IX and X?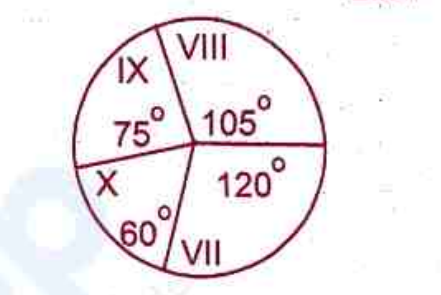
405
Total angle in pie chart = 360° corresponds to 1080 students, so 1° corresponds to 1080/360 = 3 students.
Class IX + Class X angle = 75° + 60° = 135°.
Number of students = 135 × 3 = 405. Answer: (B).
Important Questions from Classification of Data
The class marks in a frequency table are given to be 5, 10, 15, 20, 25, 30, 35, 40, 45, 50. The class limits of the first five classes are
In a test in Mathematics, 20% of the students obtained “first class”. If the data are represented by a Pie-Chart, what is the central angle corresponding to “first class”?
The following table gives the monthly expenditure of two families:
Expenditure (in Rs.)
Items
Family A
Family B
Food
3,500
2,700
Clothing
500
800
Rent
1,500
1,000
Education
2,000
1,800
Miscellaneous
2,500
1,800
In constructing a pie diagram to the above data, the radii of the circles are to be chosen by which one of the following ratios?
In an examination, 40% of candidates got second class. When the data are represented by a pie chart, what is the angle corresponding to second class?
Following histogram shows certain frequency distribution against class intervals.
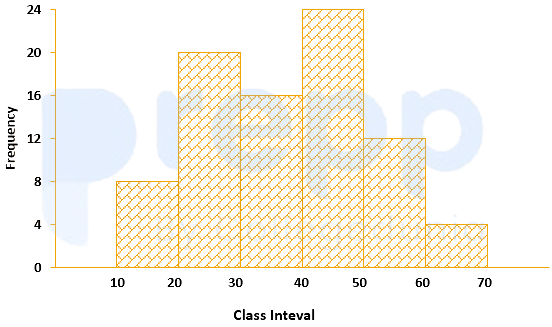
The approximated mean of this distribution is: