The figures P and Q represent schematic binary phase diagrams for solid-melt and subsolidus relations in temperature (T)-composition (X) space.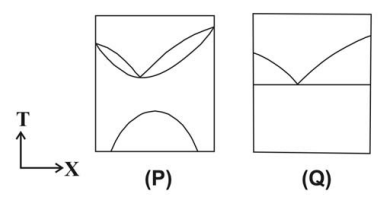
To determine the truth of the statements regarding phase diagrams given as P and Q, we need to analyze each diagram based on eutectic relations and high-temperature limited solid solutions:
- The eutectic system typically involves a binary phase diagram where a liquid solution solidifies into two distinct solid phases at the eutectic composition. Generally, it forms an L-shaped diagram that indicates a eutectic reaction.
- High-temperature limited solid solutions show a range of solid solubility extending up to a certain temperature. At elevated temperatures, the solid retains compositional diversity, usually forming a dome or a convex region in the phase diagram.
Let us now look at the provided phase diagrams (P and Q) to analyze which type of behavior each one represents:
- Upon examining Diagram P:
- The phase diagram shape and characteristics point towards a high-temperature solid solution behavior. Such diagrams typically show a region where solid is stable and wide stability over a range of compositions, characteristic of limited solid solutions.
- Upon examining Diagram Q:
- The schematic shows distinctive eutectic characteristics, where on cooling from liquid, two distinct solids are formed at a constant temperature, the eutectic point.
Considering the above analysis, the correct statement is:
P shows high temperature limited solid solution and Q shows eutectic relation.
Therefore, the answer is correctly justified by the characteristics of the phase diagrams provided.
Important Questions from Igneous Petrology (Binary and Ternary Phase Diagrams)
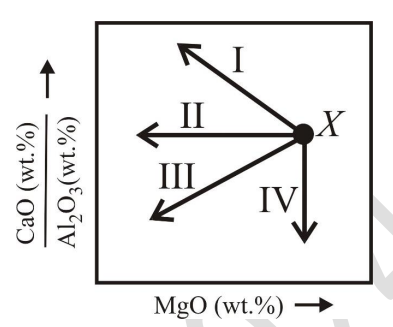
If 'X' represents the initial composition of a melt, which one of the trends indicated by arrows in the schematic diagram corresponds to the evolution of the residual melt composition during crystallization of diopside?
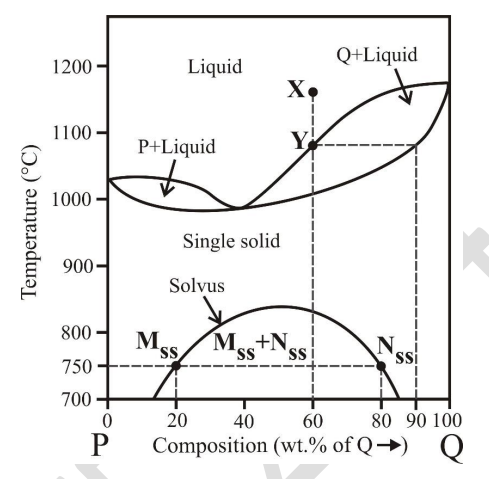
The diagram given below shows phase relations between components P and Q at 1 bar pressure. If ‘X' represents the initial liquid composition, which of the following statements is/are CORRECT during equilibrium crystallization?
- Choose the CORRECT statement regarding crystallization of a single feldspar of composition $Or_{50}Ab_{50}$ in the Albite-Orthoclase system.
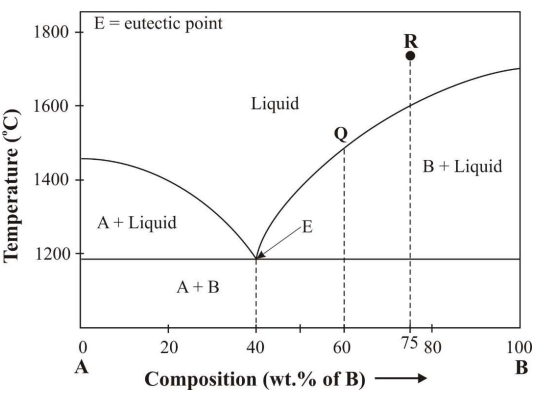
The following diagram shows phase relations in a system consisting of components A and B at 1 bar pressure. If the initial composition of liquid is R, during cooling and crystallization of magma, which of the following statement(s) is/are CORRECT?
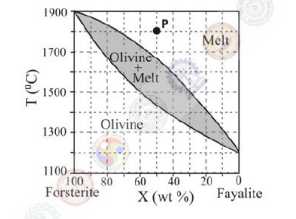
The given T-X diagram shows the phase relations in olivine solid solution at 1 bar pressure. If 'P' is the initial position of melt, the proportion of melt at $1500^\circ$C is __________ %.