The figure below represents an isobaric binary liquidus phase diagram, with the solid phases A, B and C. What are the degrees of freedom associated with equilibrium phase assemblages represented by the bulk compositions w, x, y and z, in the fields indicated in the figure?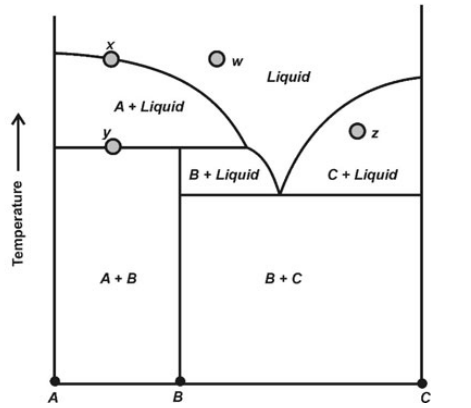
Detailed Solution
To determine the degrees of freedom for the points indicated in the phase diagram, we use the Gibbs Phase Rule. For an isobaric (constant pressure) binary system, the phase rule is expressed as:
$$ F = C - P + 1 $$
Where:
- \(F\) is the number of degrees of freedom (variance).
- \(C\) is the number of components in the system. Since it is a binary system, \(C = 2\).
- \(P\) is the number of phases in equilibrium at that point.
- The "+ 1" represents the single variable of temperature (as pressure is kept constant).
Analysis of the Points:
- Point \(w\):
This point is located in the single-phase Liquid region.
- Number of phases, \(P = 1\)
- Calculation: \(F = 2 - 1 + 1 = 2\)
- Interpretation: Both temperature and composition can be varied independently within this field without changing the number of phases.
- Point \(x\):
This point lies on the liquidus curve (the boundary between the Liquid and the \(A + \text{Liquid}\) fields). At equilibrium on this line, two phases coexist: Solid \(A\) and Liquid.
- Number of phases, \(P = 2\)
- Calculation: \(F = 2 - 2 + 1 = 1\)
- Interpretation: The system is univariant; if the temperature is changed, the composition must change along the curve to maintain equilibrium.
- Point \(y\):
This point is located on the horizontal boundary representing the transition from the \(A + \text{Liquid}\) field. In the context of phase assemblage regions in such diagrams, points on boundaries or within two-phase fields represent an equilibrium between two phases (e.g., \(A\) and Liquid or \(A\) and \(B\)).
- Number of phases, \(P = 2\)
- Calculation: \(F = 2 - 2 + 1 = 1\)
- Point \(z\):
This point is located within the \(C + \text{Liquid}\) field. Any point inside a two-phase region of a binary isobaric diagram represents an equilibrium between two phases.
- Number of phases, \(P = 2\)
- Calculation: \(F = 2 - 2 + 1 = 1\)
Summary Table:
| Point | Region/Field | Phases (\(P\)) | Degrees of Freedom (\(F\)) |
|---|---|---|---|
| \(w\) | Liquid | 1 | 2 |
| \(x\) | \(A + \text{Liquid}\) | 2 | 1 |
| \(y\) | Boundary of \(A + \text{Liquid}\) | 2 | 1 |
| \(z\) | \(C + \text{Liquid}\) | 2 | 1 |
Therefore, the degrees of freedom are \(w = 2, x = 1, y = 1, z = 1\), which matches Option 1.
Important Questions from Igneous Petrology (Binary and Ternary Phase Diagrams)
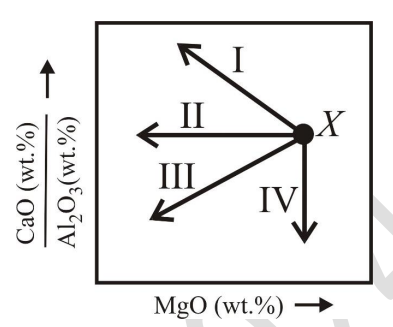
If 'X' represents the initial composition of a melt, which one of the trends indicated by arrows in the schematic diagram corresponds to the evolution of the residual melt composition during crystallization of diopside?
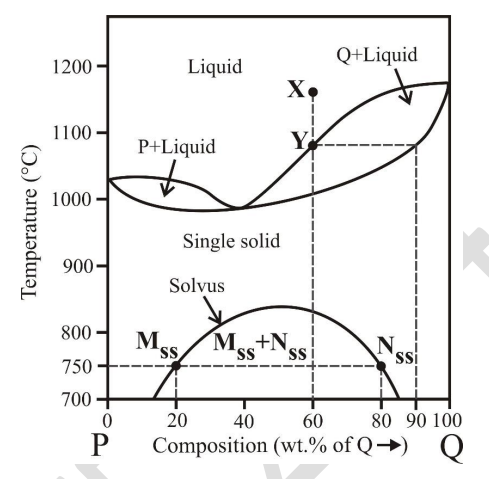
The diagram given below shows phase relations between components P and Q at 1 bar pressure. If ‘X' represents the initial liquid composition, which of the following statements is/are CORRECT during equilibrium crystallization?
- Choose the CORRECT statement regarding crystallization of a single feldspar of composition $Or_{50}Ab_{50}$ in the Albite-Orthoclase system.
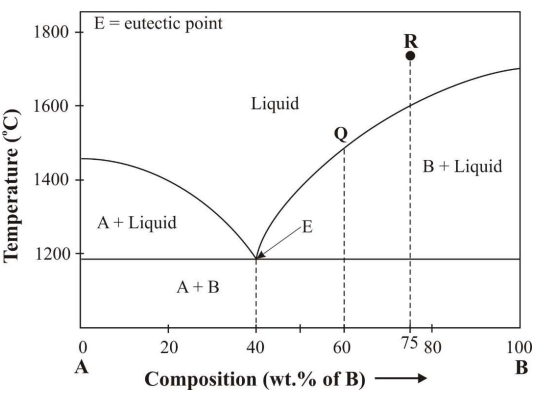
The following diagram shows phase relations in a system consisting of components A and B at 1 bar pressure. If the initial composition of liquid is R, during cooling and crystallization of magma, which of the following statement(s) is/are CORRECT?
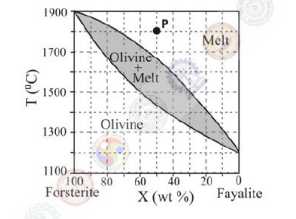
The given T-X diagram shows the phase relations in olivine solid solution at 1 bar pressure. If 'P' is the initial position of melt, the proportion of melt at $1500^\circ$C is __________ %.