The diagram given below shows phase relations between components P and Q at 1 bar pressure. If ‘X' represents the initial liquid composition, which of the following statements is/are CORRECT during equilibrium crystallization?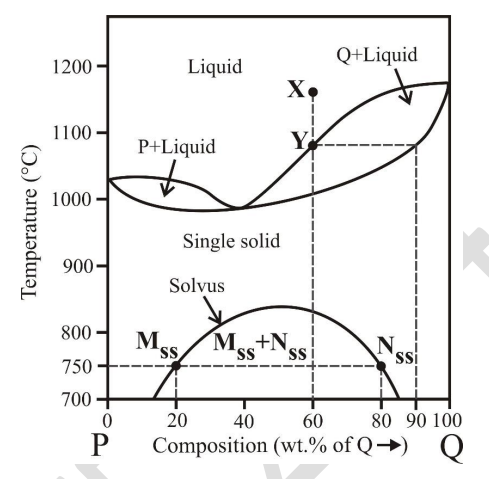
To solve this question, we need to analyze the given phase diagram and the associated options related to equilibrium crystallization.
- Let's first understand the initial liquid composition 'X'. It is given at about 60 wt.% Q based on the phase diagram. The opposite of Q would imply 40 wt.% of P.
- The composition of the solid at 'Y' involves determining the intersection of the tie line with the solidus curve. The diagram indicates that the solid in equilibrium with the liquid at 'Y' involves approximately 10 wt.% of P and 90 wt.% of Q.
- For the bulk composition of the final solid product, we consider the regions on the diagram where the material becomes solid. The solid product is made up of crystals that eventually equalize to 40 wt.% of P and 60 wt.% of Q as indicated by the final phase boundary.
- Regarding the proportion of phases Mss and Nss at 750 °C, this is observed within the solid solution field of the phase diagram. From the phase relationship at this temperature, the composition at this point gives us a ratio of 1:2 for Mss to Nss by weight percentage based on the lever rule calculation.
Thus, the correct options are logically concluded as:
- The composition of the solid in equilibrium with the liquid at ‘Y' is 10 wt.% of P and 90 wt.% of Q.
- The bulk composition of the final solid product is 40 wt.% of P and 60 wt.% of Q.
- The proportion (on the basis of wt.%) of two phases, Mss : Nss is 1 : 2 at 750 °C.
We can rule out the first option as the diagram specifies the initial composition differently. Always interpret phase diagrams by assessing the temperature and composition along the phase boundaries accurately.
Important Questions from Igneous Petrology (Binary and Ternary Phase Diagrams)
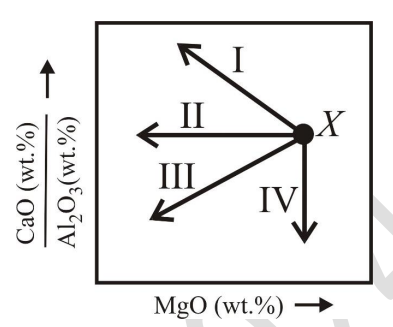
If 'X' represents the initial composition of a melt, which one of the trends indicated by arrows in the schematic diagram corresponds to the evolution of the residual melt composition during crystallization of diopside?
- Choose the CORRECT statement regarding crystallization of a single feldspar of composition $Or_{50}Ab_{50}$ in the Albite-Orthoclase system.
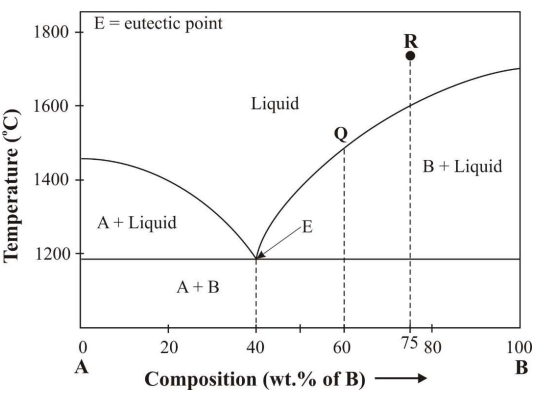
The following diagram shows phase relations in a system consisting of components A and B at 1 bar pressure. If the initial composition of liquid is R, during cooling and crystallization of magma, which of the following statement(s) is/are CORRECT?
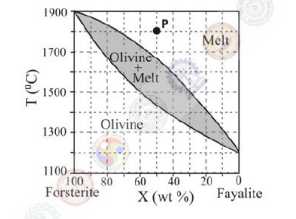
The given T-X diagram shows the phase relations in olivine solid solution at 1 bar pressure. If 'P' is the initial position of melt, the proportion of melt at $1500^\circ$C is __________ %.
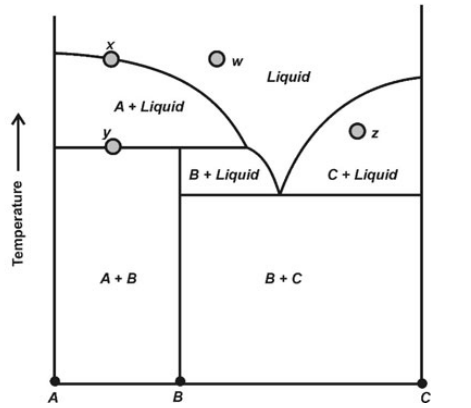
The figure below represents an isobaric binary liquidus phase diagram, with the solid phases A, B and C. What are the degrees of freedom associated with equilibrium phase assemblages represented by the bulk compositions w, x, y and z, in the fields indicated in the figure?