Question
Which of the following plot(s) is/are correct representation(s) of Boyle's Law?
This question was previously asked in
WBJEE 2026 Physics and Chemistry Question Paper (24-May-2026)
Identifying Correct Boyle's Law Plots
Boyle's Law describes the relationship between the pressure ($P$) and volume ($V$) of a fixed amount of gas at constant temperature ($T$). The law states that pressure is inversely proportional to volume:
$P \propto \frac{1}{V} \quad \text{or} \quad PV = k$
where $k$ is a constant.
We need to evaluate which of the given plots correctly represents this relationship.
Analysis of Plots:
-
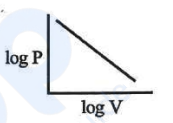
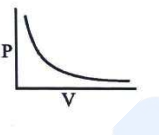
Plot 1 (Option A): This graph plots Pressure ($P$) versus Volume ($V$). According to Boyle's Law, $P = \frac{k}{V}$. This equation represents a hyperbola. The plot shows a curve where pressure decreases as volume increases, consistent with a hyperbolic relationship.
 Conclusion: Correct.
-
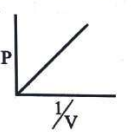
Plot 2 (Option B): This graph plots Pressure ($P$) versus the inverse of Volume ($\frac{1}{V}$). Since $P \propto \frac{1}{V}$, this relationship should be linear and pass through the origin. The plot shows a straight line passing through the origin ($P = k \times \frac{1}{V}$).
 Conclusion: Correct.
-
Plot 3 (Option C): This graph plots the product of Pressure and Volume ($PV$) versus Pressure ($P$). Boyle's Law states $PV = k$, meaning the product $PV$ is constant. The plot shows a horizontal line, indicating that $PV$ remains constant irrespective of changes in $P$.
 Conclusion: Correct.
-
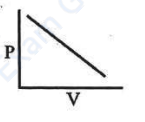
Plot 4 (Option D): This graph plots Pressure ($P$) versus Volume squared ($V^2$). Boyle's Law ($P = \frac{k}{V}$) does not suggest a relationship between $P$ and $V^2$ in this manner. The plot shows pressure increasing significantly with $V^2$, contradicting the inverse relationship.
 Conclusion: Incorrect.
Final Determination
The plots that correctly represent Boyle's Law are the ones showing the hyperbolic relationship between $P$ and $V$, the linear relationship between $P$ and $1/V$, and the constant product $PV$. These correspond to the first three plots (Options A, B, and C).
Was this answer helpful?
Similar Questions
- In a conductance experiment, aqueous $\text{AgNO}_{3}$ solution is added to aqueous $\text{KCl}$ solution gradually and simultaneously the molar conductivity ($\lambda_{m}$) is measured. The correct plot of $\lambda_{m}$ versus volume of $\text{AgNO}_{3}$ solution is
- Three engines A, B and C take steam at $130^{\circ}\text{C}$ and reject it at $20^{\circ}\text{C}, 40^{\circ}\text{C}$ and $50^{\circ}\text{C}$ respectively. The most efficient engine will be
- The van't Hoff Factor ($i$) for a dilute aqueous solution of $\text{Na}_{2}\text{SO}_{4}$ is
- A compound contains two types of atoms $A$ and $B$. Its crystal structure is a cubic lattice with '$A$' atoms at the corner of the unit cells and '$B$' atoms at the body centres. The simplest formula of the compound will be
- The van der Waal's equation : $\left(P + \frac{a}{4V^2}\right)\left(V - \frac{b}{2}\right) = \frac{RT}{2}$ is valid for
- In a first order reaction, the concentration of reactant decreases from $400\text{ moles lit}^{-1}$ to $50\text{ moles lit}^{-1}$ in $7.5 \times 10^3\text{ s}$. The rate constant of the reaction is (approximately)
- The mass of an electron is $9.1 \times 10^{-31}\text{ kg}$. If its K.E. is $3.0 \times 10^{-25}\text{ J}$, its wavelength is (approximately)
- Glucose is added to 1 litre of water to such an extent that $\Delta T_f / K_f$ equals to $\frac{1}{1000}$. The weight of glucose added is
- An organic compound undergoes first order decomposition. The time taken for its decomposition to $\frac{1}{8}\text{th}$ and $\frac{1}{10}\text{th}$ of its initial concentration are $t_{1/8}$ and $t_{1/10}$ respectively. The value of $\left[ \frac{t_{1/8}}{t_{1/10}} \right]$ is
[Given $\log_{10} 2 = 0.3$] - 1 mole of an ideal gas undergoes the following processes:
Process A $\rightarrow$ Isothermal expansion at 400K from volume $V_1$ to volume $V_2$, such that $V_2 = 4V_1$
Process B $\rightarrow$ Adiabatic expansion from volume $V_1$ to volume $V_2$, such that $V_2 = 4V_1$
Consider the following statements and select the correct one/s.
Important Questions from Physical Chemistry
- Consider two Group IV metal ions $\text{X}^{2+}$ and $\text{Y}^{2+}$.
A solution containing 0.01 M $\text{X}^{2+}$ and 0.01 M $\text{Y}^{2+}$ is saturated with $\text{H}_2\text{S}$. The pH at which the metal sulphide YS will form as a precipitate is ______. (Nearest integer)
(Given: $\text{K}_{sp}(\text{XS}) = 1 \times 10^{-22}$ at $25^\circ\text{C}$, $\text{K}_{sp}(\text{YS}) = 4 \times 10^{-16}$ at $25^\circ\text{C}$, $[\text{H}_2\text{S}] = 0.1\text{M}$ in solution, $\text{K}_{a1} \times \text{K}_{a2}(\text{H}_2\text{S}) = 1.0 \times 10^{-21}$, $\log 2 = 0.30$, $\log 3 = 0.48$, $\log 5 = 0.70$) - The half-life of ${}^{65}\text{Zn}$ is 245 days. After x days, 75% of original activity remained. The value of $x$ in days is _______. (Nearest integer)
(Given: $\log 3 = 0.4771$ and $\log 2 = 0.3010$) - Molar conductivity of a weak acid HQ of concentration $0.18 \text{ M}$ was found to be $1/30$ of the molar conductivity of another weak acid HZ with concentration of $0.02 \text{ M}$. If $\lambda^\circ_{Q^-}$ happened to be equal with $\lambda^\circ_{Z^-}$, then the difference of the $\text{pK}_a$ values of the two weak acids ($\text{pK}_a\text{(HQ)} - \text{pK}_a\text{(HZ)}$) is _______ (Nearest integer).
[Given: degree of dissociation ($\alpha$) < < 1 for both weak acids, $\lambda^\circ$ : limiting molar conductivity of ions] - The first and second ionization constants of $\text{H}_2\text{X}$ are $2.5 \times 10^{-8}$ and $1.0 \times 10^{-13}$ respectively. The concentration of $\text{X}^{2-}$ in $0.1\text{ M}$ $\text{H}_2\text{X}$ solution is __________ $\times 10^{-15}\text{ M}$. (Nearest Integer)
- The osmotic pressure of a living cell is $12\text{ atm}$ at $300\text{ K}$. The strength of sodium chloride solution that is isotonic with the living cell at this temperature is __________ $\text{g L}^{-1}$. (Nearest integer)
Given : $\text{R} = 0.08\text{ L atm K}^{-1}\text{ mol}^{-1}$
Assume complete dissociation of $\text{NaCl}$
(Given : Molar mass of $\text{Na}$ and $\text{Cl}$ are $23$ and $35.5\text{ g mol}^{-1}$ respectively.)
Need Expert Advice?
More Questions from WBJEE