Instruction: Study the following graph and answer the questions given. (Number of students enrolled in two different schools in certain years) (Legend: स्कूल A (blue bars) = School A; स्कूल B (orange bars) = School B)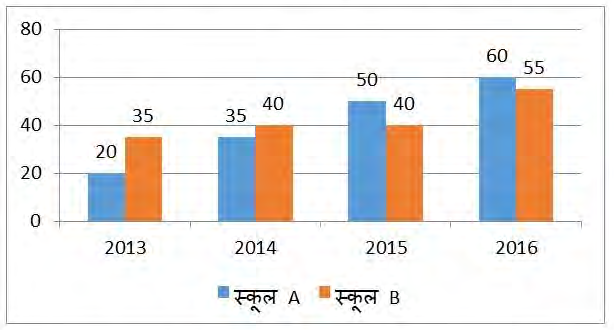
What was the ratio of the total number of students enrolled in School A in 2013 and the total number of students enrolled in both schools in 2016?
4 : 23
4 : 23 is correct.
A comparison of two quantities is written in its simplest form by dividing both terms by their highest common factor.
From the graph, School A in 2013 = 20.
Both schools in 2016 = \(60 + 55 = 115\).
Required comparison = \(20 : 115 = 4 : 23\) (dividing both terms by 5).
Similar Questions
What is the ratio of average production of company Y in 1997-1999 to the average production of company Z in the same period?
What is the percentage increase in the production of company X from 1996 to 1997?
Which company had the minimum average production in five years?
The foreign exchange reserves in 1997-98 were how many times those in 1993-94?
What is the percentage increase in the foreign exchange reserves during 1996-1997 compared to the previous year?
The foreign exchange reserves in 1994-95 were approximately what percent of the average foreign exchange reserves of the period under review?
What is the difference between the total production of vehicles in 2012-13 and 2013-14 and the total sales of vehicles in 2011-12 and 2014-15?
During the 5 years, by what percentage is the average annual production of vehicles more than the average annual sales of vehicles? (correct to two decimal places)
What is the ratio of the total production of vehicles during 2010-11 and 2011-12 to the total sales of vehicles during 2012-13 and 2014-15?
In the bar chart given below, the total exports of a country (in ₹ 1000 crore) for 7 consecutive years Y1, Y2, Y3, Y4, Y5, Y6 and Y7 are shown.
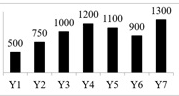
Which year shows the maximum percentage change in exports compared to the previous year?
Important Questions from Bar Graph
Directions:
Study the following Bar-chart and the data provided to answer the questions that follow:
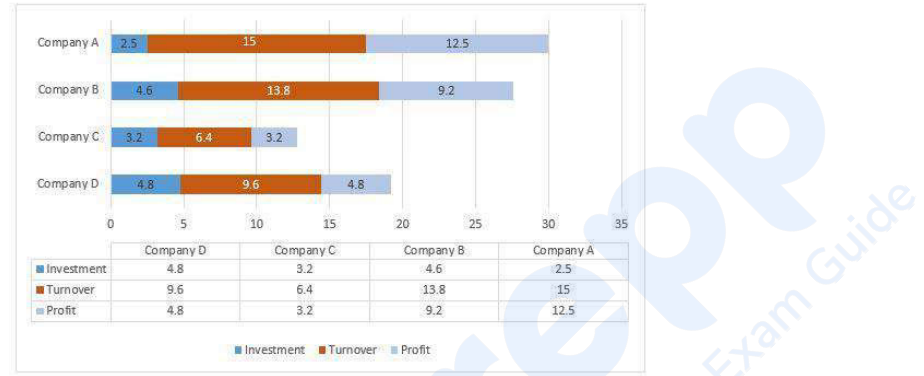
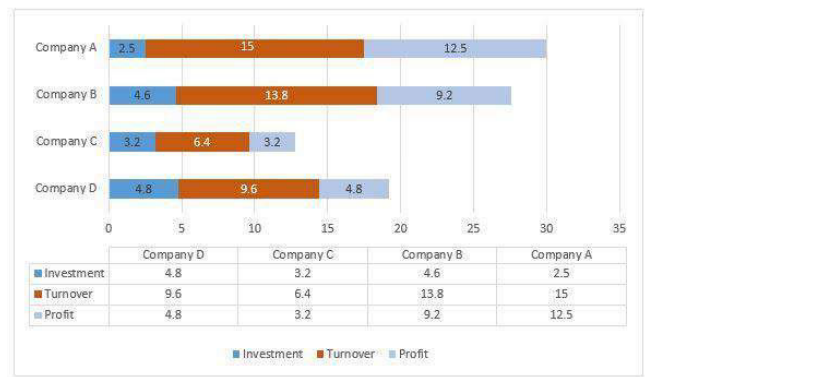
Investment, Turnover and Profit of four different companies A, B, C and D are given. (In Lakhs)
What percentage of turnover of company D is profit of company C. (Upto two decimals).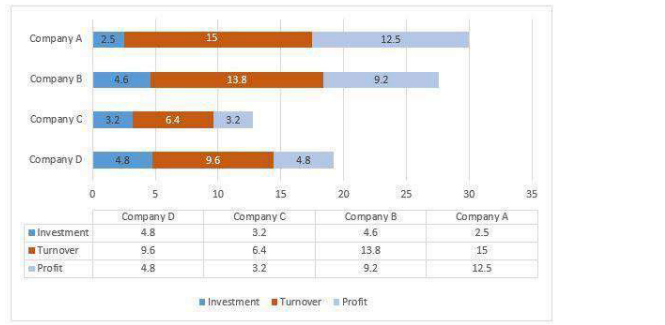
- Find the total number of employees in factory Q over the given years. (In hundreds)
- What is the average number of employees in factory R over the given years approximately? (In hundreds)
Study the following Bar-chart and the data provided to answer the questions that follow:Investment, Turnover and Profit of four different companies A, B, C and D are given. (In Lakhs)Investment, Turnover and Profit of four different companies A, B, C and D are given. (In Lakhs)Out of the given four companies which one has highest profit proportion? (Profit proportion = Profit/Investment)
Directions:
Study the following Bar-chart and the data provided to answer the questions that follow:
Investment, Turnover and Profit of four different companies A, B, C and D are given. (In Lakhs)
What is the gain percentage of Company C?