Directions: The following pie chart represents the amount spent on different sports by a school in a calendar year. If the amount spent on football is ₹ 9,000, answer the following questions :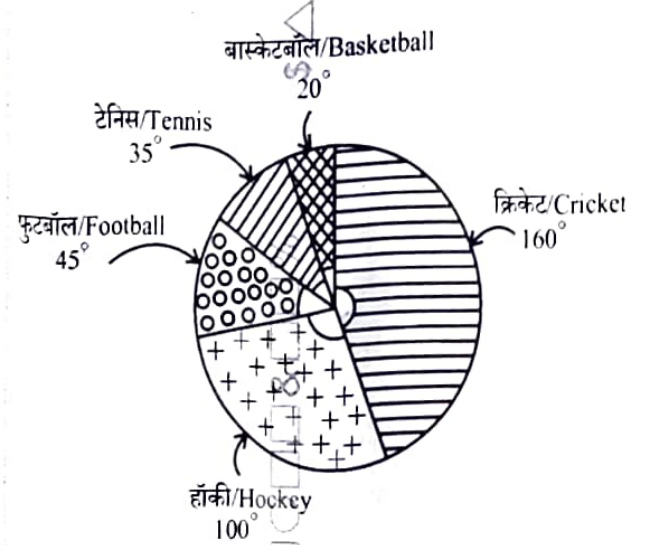
What is the total amount spent on all the sports ?
₹ 72,000
The whole pie chart represents the total spending on all the sports, so the total is simply the value of the complete 360°.
Football covers 45° and stands for ₹ 9,000, so one degree is worth \(\frac{9{,}000}{45} = 200\) rupees.
The total is therefore \(360 \times 200 = 72{,}000\).
A quick check confirms this: Football 45°, Hockey 100°, Cricket 160°, Tennis 35° and Basketball 20° add to exactly 360°, so nothing has been left out.
Hence, the total amount spent on all the sports is ₹ 72,000.
Similar Questions
If Institute B increases its fee per candidate by 25%, while the number of candidates remains unchanged, what will be the new total fee collected by all five institutes ?
By how much does the weighted average training fee per candidate for institutes that trained 250 or fewer candidates exceed that for institutes that trained more than 250 candidates ?
If the total amount spent on Football increases from ₹ 9,000 to ₹ 18,000 (and the pie chart remains unchanged), the combined amount spent on Hockey and Basketball is :
What is the total fee collected by all five institutes ?
The combined fee collected by Institutes A and C is in what ratio to the combined fee collected by Institutes D and E ?
How much more is spent on Hockey than on Football ?
Institute D reduces the number of candidates trained by 20%, while increasing the fee per candidate by 25%. What will be the fee collected by Institute D after the changes ?
What is the amount spent on Basketball ?
What fraction of the total amount is spent on Cricket ?
Important Questions from Data Interpretation
The table shows the monthly expenditure of Saumya. What percent of her monthly salary is she able to save?
Expense Amount Food 5,000 Rent 20,000 Travel 10,000 Clothing 3,000 Miscellaneous 15,000 Savings 7,500 Following table provides figures (in rupees) on annual expenditure of a firm for two years – 2010 and 2011.
Category
2010
2011
Raw material
5200
6240
Power & fuel
7000
9450
Salary & wages
9000
12600
Plant & machinery
20000
25000
Advertising
15000
19500
Research & Development
22000
26400
In 2011, which of the following two categories have registered increase by same percentage?
Read the following table giving sales data of five types of batteries for years 2006 to 2012
Year
Type I
Type II
Type III
Type IV
Type V
2006
75
144
114
102
108
2007
90
126
102
84
126
2008
96
114
75
105
135
2009
105
90
150
90
75
2010
90
75
135
75
90
2011
105
60
165
45
120
2012
115
85
160
100
145
Out of the following which type of battery achieved highest growth between the years 2006 and 2012?Each of the letters arranged as below represents a unique integer from 1 to 9. The letters are positioned in the figure such that (A × B × C), (B × G × E) and (D × E × F) are equal. Which integer among the following choices cannot be represented by the letters A, B, C, D, E, F and G?
A
D
B
G
E
C
F
The time spent to study history and chemistry is 4 hours 30 minutes. Then the student studied physics for