The following table shows the average speed (in km per hour) of five different trains A-E during six days of a week from Monday through Saturday. Some data is missing in the table ( indicated as '-') that you are expected to calculate, if required. Based on the data in the table, answer the question that follows: Train - wise speed (in km/hour) on different DaysTrain Average Speed (in km/hr) of Trains Monday Tuesday Wednesday Thursday Friday Saturday A 72 80 - 64 54 - B 88 - 80 84 72 90 C 54 70 72 - 64 60 D - 120 95 - 90 110 E 72 80 84 75 - -
Train D runs 150 km more on Monday than that on Thursday and times taken by the train on Monday and Thursday are 5 hour and 4 hours, respectively. If the average speed of this train on Monday is 15 km/hour more than that on Thursday, then the mean of the distance travelled by the train on Monday and Thursday is
375 km
Let train D's Thursday speed = s km/hour. Then Monday speed = s + 15 (given 15 more).
Distance = speed × time. Monday time = 5 h, Thursday time = 4 h.
Monday distance = 5(s + 15); Thursday distance = 4s.
Monday runs 150 km more than Thursday: 5(s + 15) − 4s = 150.
Expand: 5s + 75 − 4s = 150 ⇒ s + 75 = 150 ⇒ s = 75.
So Thursday speed = 75, Monday speed = 90.
Monday distance = 5 × 90 = 450 km; Thursday distance = 4 × 75 = 300 km.
Mean distance = (450 + 300) / 2 = 750 / 2 = 375 km.
Hence 375 km is correct. The other figures come from arithmetic slips in solving for s.
Similar Questions
The ratio of the number of females to the number of males in City-E working in SBI, UCO and IOB together is :
The approximate percentage of the number of females with respect to the number of males across all the banks together in City-B is :
The number of females working in UCO from City-A is approximately _____ % more than the number of females working in PNB from the same city.
The total number of females working across all the six cities together is more than 1700 in :
The difference between the number of males working across all the six banks together in City-C and the number of males working across all the six banks together in City-D is :
What is the number of Model-Q cars sold in all cities together?
What is the difference between Model-P cars sold in city-D and city E ?
The number of Model-P cars sold in City D is approximately _____ % of the number of Model-R cars sold in City A
What is the ratio of the number of cars sold in City C to the number of Model-Q cars sold in City D?
Number of cars sold in City F is approximately _______ % more than the number of cars sold in City B
Important Questions from Tabulation
- An object is placed beyond the centre of curvature (C) of a concave mirror. The image formed will be now:
Directions:
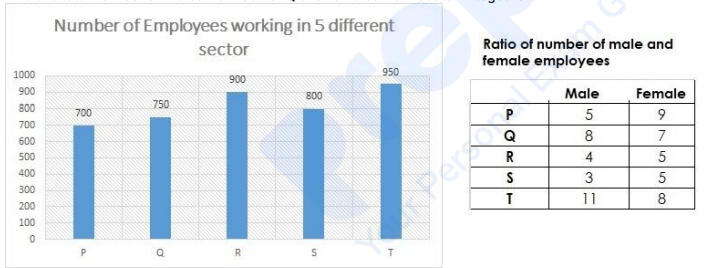
Using the data from the graph answer the question below:
Find the total number of males from sector P and females from sector R together.
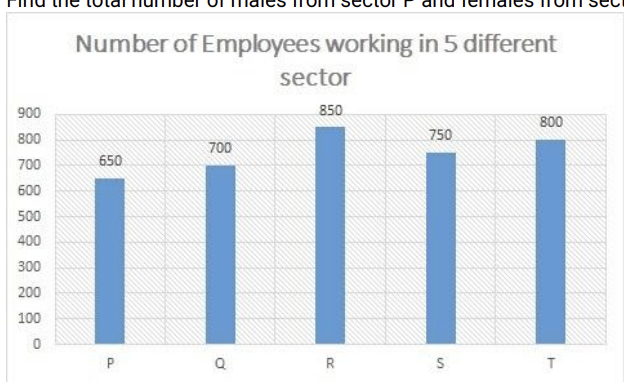
Ratio of number of male and female employees
Male Female P 6 7 Q 5 9 R 9 8 S 7 8 T 3 5 Directions:
Using the data from the graph answer the question below:
Number of Employees working in 5 different sector:
Find the number of males from sector Q.
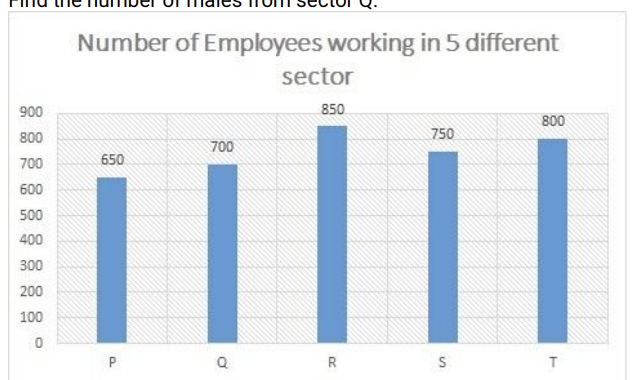
Ratio of number of male and female employees:
Male Female P 6 7 Q 5 9 R 9 8 S 7 8 T 3 5 Directions:
Using the data from the graph answer the question below:
Find the ratio between number of males from the sector T to number of females from the sector S.
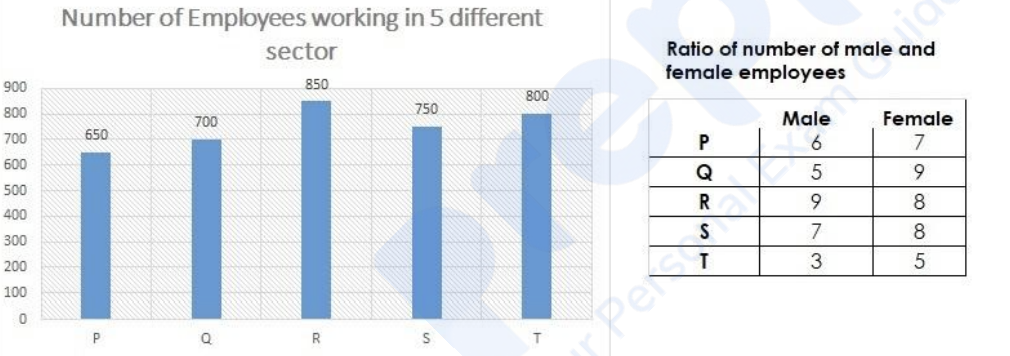
Directions:
Using the data from the graph answer the question below:
Find the total number of males from sector Q and females from sector P together.