
Question
The variation of $w$ against $x$ is shown in the figure for selected values of parameter $y$.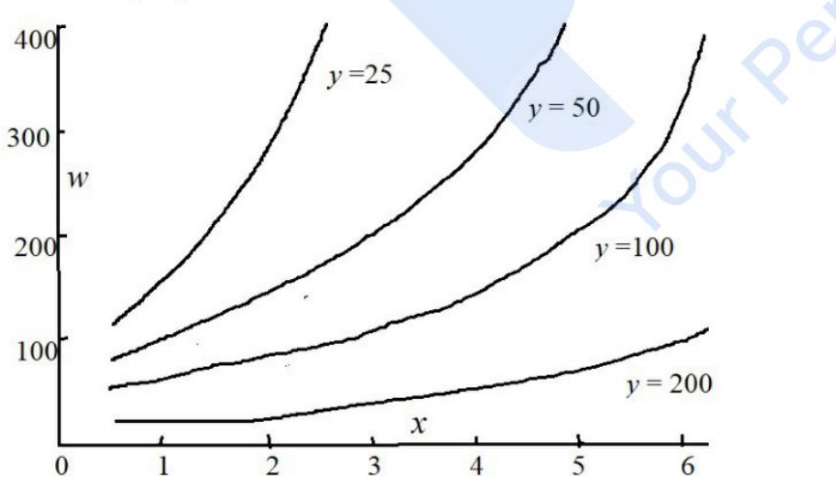
The graph indicates that $w$
The correct answer is
increases nonlinearly with $x$, but decreases nonlinearly with $y$.
The given graph shows the relationship between w and x for selected values of the parameter y. Let's analyze the graph to determine the nature of these relationships.
- Observe the graph for w against x for different values of y. The curves are not straight lines, indicating a nonlinear relationship between w and x.
- Notice how the curves are steeply increasing as x increases, supporting the idea that w increases nonlinearly with x.
- As the parameter y increases (moving from y=25 to y=200), the curves shift downward. This suggests that w decreases with increasing y.
- The downward shift of curves as y increases is not linear. Thus, w decreases nonlinearly with y.
Conclusion: Based on the analysis, the graph indicates that w increases nonlinearly with x and decreases nonlinearly with y. Therefore, the correct option is:
increases nonlinearly with x, but decreases nonlinearly with y.
Was this answer helpful?
Important Questions from Geometry (Notes)
- A 6 cm long chord of a circle is at a distance of 4 cm from the centre of the circle. Find the distance of 8 cm long chord of the same circle from the centre.
- In a triangle PQR, if $\angle P + \angle R = 150^\circ$ and $\angle P + 3\angle Q = 170^\circ$, then $\angle P$ is equal to :
- PQR is a triangle. The bisectors of the internal angle $\angle Q$ and external angle $\angle R$ intersect at M. If $\angle QMR = 40^\circ$, then $\angle P$ is :
- A $2\text{ m}$ long ladder is to reach a wall of height $1.75\text{ m}$. The largest possible horizontal distance of the ladder from the wall could be
Three-quarters of a circle is shown in the figure; OA and OB are two radii perpendicular to each other. C is a point on the circle.
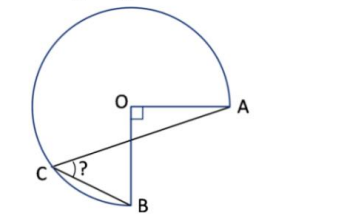
What is angle ACB?
Need Expert Advice?


