Direction : Study the following pie chart and answer the questions that follow : Distribution of fresh fruit stock in a supermarket Total stock of fresh fruits = 900 kg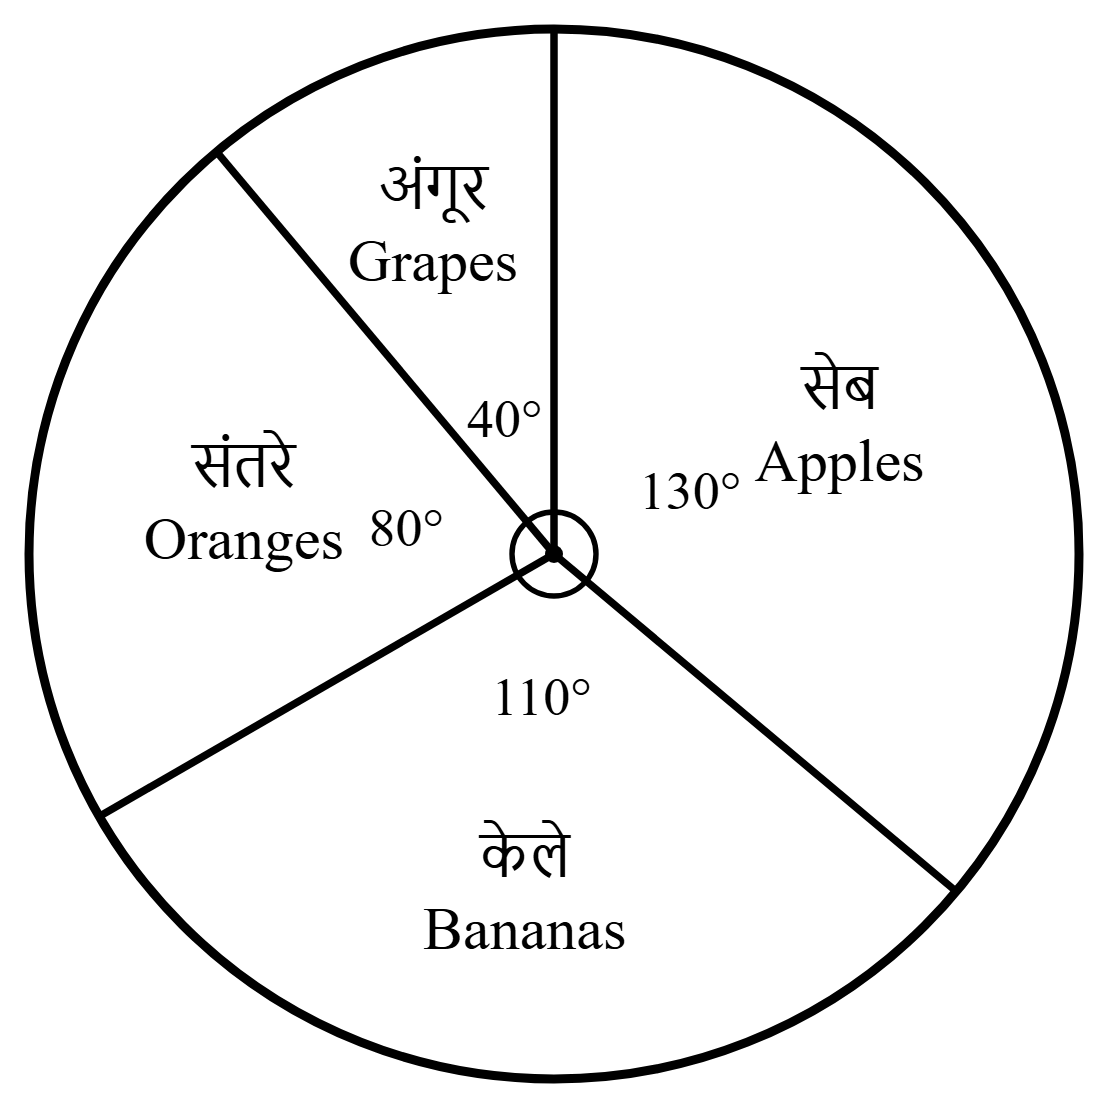
The stock of Apples is what percentage greater than the stock of Oranges ?
62·5%
In the pie chart the full circle of 360° stands for the total stock of 900 kg, so each degree represents \(\frac{900}{360} = 2.5\text{ kg}\). Weight of a fruit = its central angle × 2.5 kg.
Step 1 — Apples = 130 × 2.5 = 325 kg and Oranges = 80 × 2.5 = 200 kg. (Equivalently, the angles 130° and 80° can be compared directly.)
Step 2 — Excess of Apples over Oranges = 325 − 200 = 125 kg.
Step 3 — Percentage greater = \(\frac{125}{200} \times 100 = 62.5\%\). The figures 50·5%, 60·5% and 65·5% do not equal this value.
62·5% option is correct.
Similar Questions
What is the total number of graduate and postgraduate level students in Institute R ?
How many students in Institutes M and S are studying at the graduate level ?
What is the ratio between the number of students studying at the postgraduate level from Institute S and the number of students studying at the graduate level from Institute Q ?
The total number of students studying at the postgraduate level at Institutes N and P is :
What is the ratio between the number of students studying at postgraduate and graduate levels respectively in Institute S ?
If the university admits 300 new students and all of them commute by Bus, what percentage of the new total student population will commute by Bus ?
What fraction of the total number of students commute to the university by both Motorcycle and Bicycle ?
If 50 students who currently commute by Car switch to Bicycle, what will be the new central angle representing the Bicycle sector ?
What is the total number of students who commute to the university by both Bus and Car ?
What is the ratio of the total number of students who commute by both Bus and Car to the total number of students who commute by both Motorcycle and Bicycle ?
Important Questions from Pie Chart
Study the following pie-charts carefully to answer the questions.
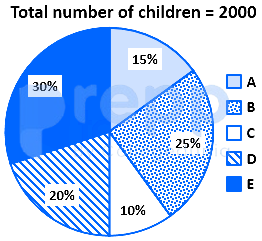
If 70 percent children from village D go to school then what is the number of children attending school from village D ?
Study the following pie-charts carefully to answer the questions.Percentage break-up of number of children in five different villages
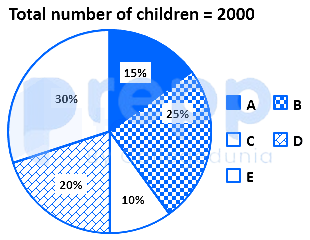
What is the respective ratio of total number of children from village A to village C ?
Study the following pie-charts carefully to answer the questions.Percentage break-up of number of children in five different villages
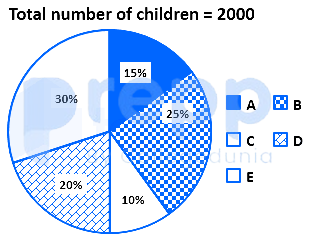
What is the total number of children in villages B and E ?
Study the chart and answer the question based, on the pie chart.The pie chart is given below shows expenditures incurred by a family on various items and savings in a month. Savings of the family is ₹ 8,000 in a month.
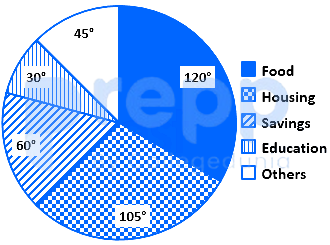
What is the total expenditure of the family for the month?
Study the chart and answer the question based, on the pie chart.The pie chart given below shows expenditures incurred by a family on various items and savings in a month. Savings of the family is ₹ 8,000 in a month.
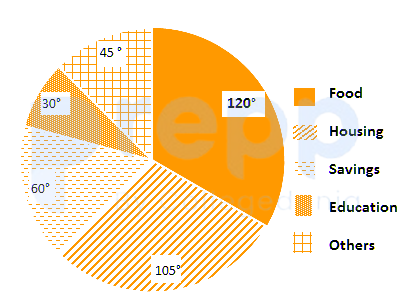
How much more amount is spent on food than on housing?