The given Venn Diagram represents employees in an organisation: The triangle represents executives, the circle represents females, the rectangle represents MBAs and the square represents technical staff. The numbers given in the diagram represent the number of persons in that particular category. How many female executives are there in the organisation?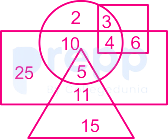
5
According to the given diagram,
The shaded part represents number of female executives.
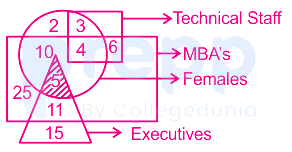
Number of female executives in the organisation are ‘5’
Hence, “5” is the correct answer.
Similar Questions
Select the Venn diagram that best illustrates the relationship among the following classes.
Neptune, Planet, Moon
Select the Venn diagram that best illustrates the relationship between the following classes.
Planets, Mars, Venus
Select the Venn diagram that best represents the relationship among the following classes.
Electronic gadgets, Mobile phones, Table, Laptops
Select the Venn diagram that best represents the relationship between the following.
Living organisms, Omnivores, Deer, Planet
Which of the following Venn diagrams best represents the relationship between the following classes?
Accountants, Girls, Internet usersSelect the Venn diagram that best illustrates the relationship among the following classes.
Whisk, Utensil, Sickle
Select the set of classes the relationship among which is the best illustrated by the given Venn diagram.

Select the Venn diagram that best illustrates the relationship between the following classes.
Brothers, Fathers, Tax-payers
Identify the diagram that best represents the relationship among the given classes.
Real number, Integer, Natural numberWhich of the following Venn diagrams best represents the relationship between the following classes?
Lady Constables, Uncles, Mothers
Important Questions from Logical Venn Diagram
Select the Venn diagram that best illustrates the relationship among the following classes.
Neptune, Planet, Moon
Teacher, College, Student –
Cabinet, Home Minister, Minister –
Professor, Researcher, Scientist –
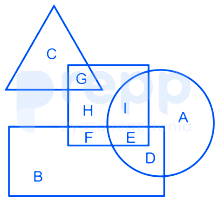
In the following figure, square represents Teachers, triangle represents swimmers, circle represents Nurses and rectangle represents Women. Which set of letters represent Teachers who are either swimmers or nurses?