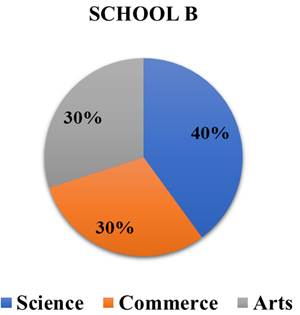
The given pie charts show the distribution of students in different streams in two schools, A and B. If school A has 1000 students and school B has 1200 students, what is the difference in the number of students in the science stream between the two schools?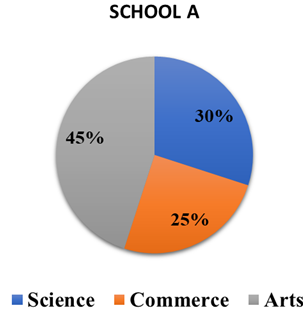
180
From the pie charts, science is 30% in School A and 40% in School B.
Science students in School A = 30% of 1000 = 300.
Science students in School B = 40% of 1200 = 480.
Difference = 480 − 300 = 180.
Hence, the answer is 180.
Similar Questions
A school conducted a survey of co-curricular activities opted by students in 2023 and 2024.
The results are shown in the two pie charts below:
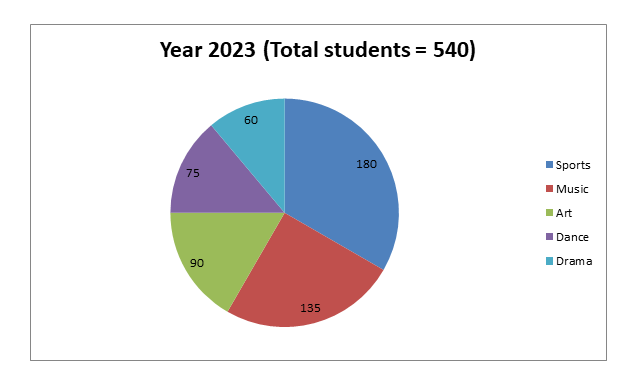
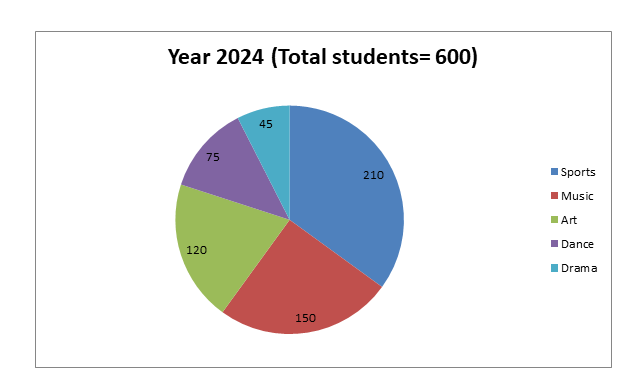
By what percentage did the number of students choosing Art increase from 2023 to 2024? (Approximately)
Study the two pie-charts given below and answer the question that follows.
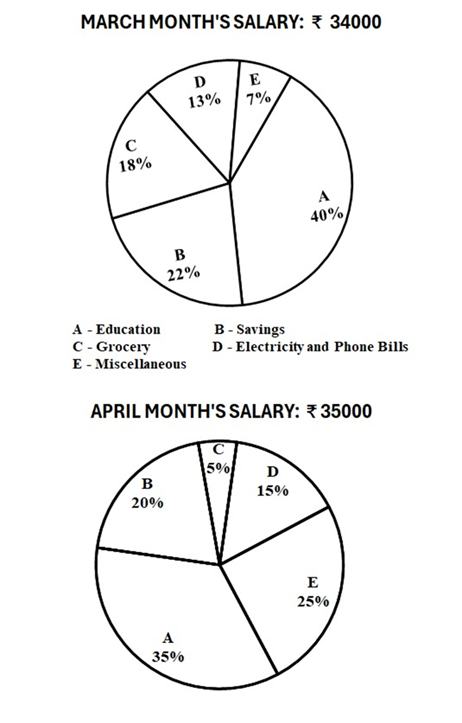
Find the ratio of the amount spent for education from March’s salary and that spent for grocery from April’s salary.
The following pie chart shows how a company spends its annual budget across sectors. If the total budget is Rs. 20,00,000, how much amount (in Rs.) is spent on Research and Transport together?
Annual Budget Distribution35%25%20%10%10%
SalariesMarketingResearchTransportMiscellaneous
As the multiple pie charts below depict, School A spends 33.3% of its budget on teacher salaries while School B spends 25.5% of its budget on the same.
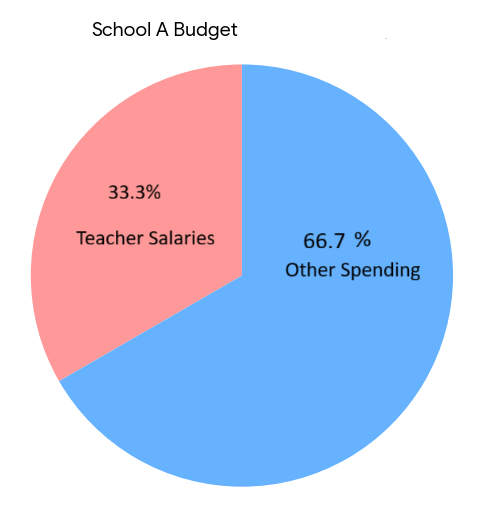
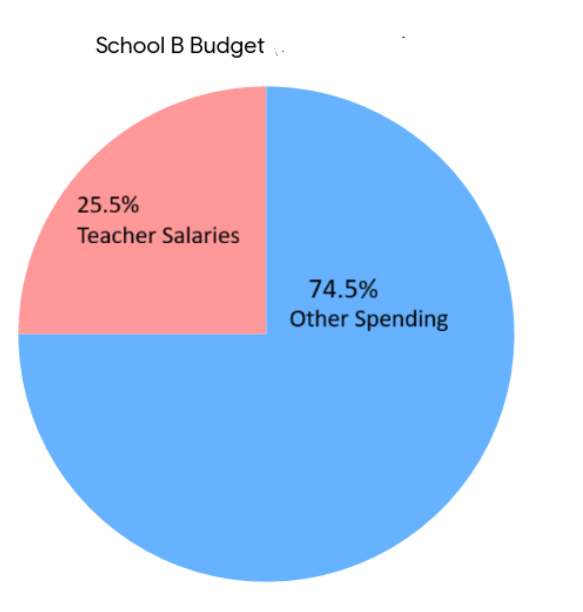
If both have equal total budgets of ₹36,00,000, how much more (in ₹) does School A spend on salaries than School B?
Study the given pie charts and answer the question that follows. The pie charts below show the distribution of students in a school.
Class-wise Distribution of Students20%25%30%15%
Class 6Class 7Class 8Class 9
Gender Distribution in Class 860%40%
BoysGirls
What is the number of girls in Class 8?
Study the given pie charts and answer the question that follows. The pie charts show the distribution of expenditure of a company across multiple areas in 2024 and 2025. The total expenditure in 2024 was Rs. 18,00,000 and the total expenditure in 2025 was Rs. 24,00,000. Find the increase in expenditure (in Rs.) on Research from 2024 to 2025.
Expenditure Distribution 202440%20%15%10%15%
SalariesMarketingResearchTransportMiscellaneous
Expenditure Distribution 202535%25%20%10%10%
SalariesMarketingResearchTransportMiscellaneous
Study the given pie charts and answer the question that follows. The first pie chart shows the percentage distribution of total population of six villages in 2024 and the second pie chart shows the percentage distribution of female population in these six villages in 2024.
Total Population - 6 Villages (2024)25%10%12%20%15%18%
PQRSTU
Female Population - 6 Villages (2024)28%13%8%16%12%23%
PQRSTU
What is the total number of males in village T and P together?
The given pie charts represent distribution of candidates who were enrolled for MBBS entrance exam and the candidates (out of those enrolled) who passed the exam in different institutes (A, B, C, D and E).
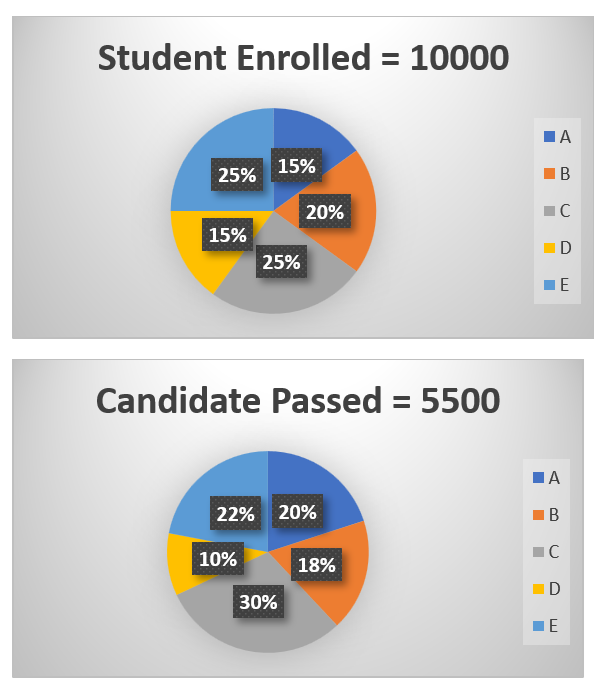
For Institutes A and E together, what is the percentage of candidates who passed out of the total candidates enrolled?
A company has 1200 employees divided into various departments. The pie chart below shows the percentage distribution of employees across different departments.
Percentage Distribution of Employees25%20%10%15%30%
OperationsSalesHRFinanceIT
If 15% of the employees in the Sales Department are transferred to the IT Department, how many employees will be left in Sales, and what will be the new percentage of IT employees in the company, respectively?
Study the data of the number of accidents on different days of a week in the given pie chart and answer the question below it.
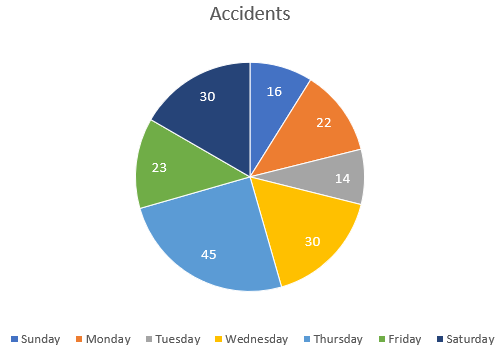
If the data of Thursday is dropped and rest of the data is plotted on a pie chart, then what is the difference in angles (in degrees) made at the centre by Wednesday earlier and now?
Important Questions from Pie Chart
Study the following pie-charts carefully to answer the questions.
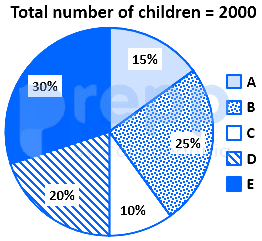
If 70 percent children from village D go to school then what is the number of children attending school from village D ?
Study the following pie-charts carefully to answer the questions.Percentage break-up of number of children in five different villages
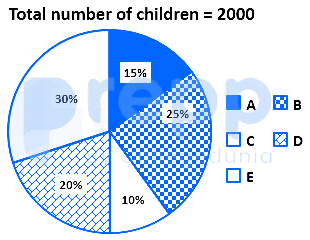
What is the respective ratio of total number of children from village A to village C ?
Study the following pie-charts carefully to answer the questions.Percentage break-up of number of children in five different villages
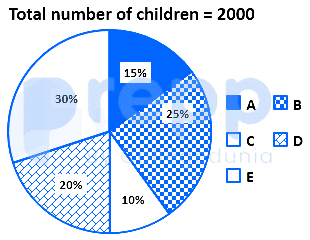
What is the total number of children in villages B and E ?
Study the chart and answer the question based, on the pie chart.The pie chart is given below shows expenditures incurred by a family on various items and savings in a month. Savings of the family is ₹ 8,000 in a month.
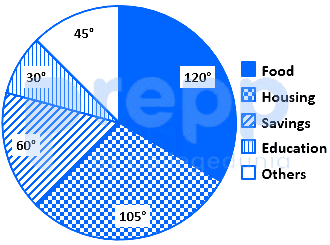
What is the total expenditure of the family for the month?
Study the chart and answer the question based, on the pie chart.The pie chart given below shows expenditures incurred by a family on various items and savings in a month. Savings of the family is ₹ 8,000 in a month.
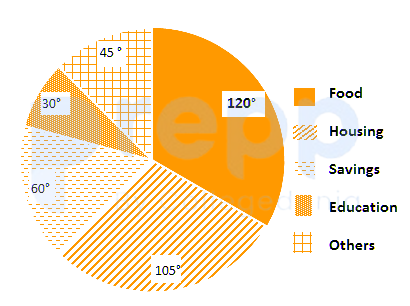
How much more amount is spent on food than on housing?