The given bar graph shows the income and expenditure (in ₹ crores) of a company during 5 years (2014 to 2018). In which year is the ratio of the income to expenditure the lowest and highest, respectively?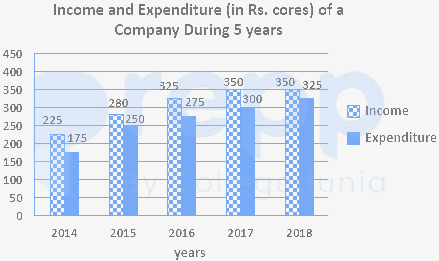
Given:
Year | Income | Expenditure |
2014 | 225 | 175 |
2015 | 280 | 250 |
2016 | 325 | 275 |
2017 | 350 | 300 |
2018 | 350 | 325 |
Calculation:
Year | Income | Expenditure | Ratio |
2014 | 225 | 175 | 225 / 175 = 1.29 |
2015 | 280 | 250 | 280 / 250 = 1.12 |
2016 | 325 | 275 | 325 / 275 = 1.18 |
2017 | 350 | 300 | 350 / 300 = 1.17 |
2018 | 350 | 325 | 350 / 325 = 1.08 |
∴ In the year 2018, ratio was the lowest while in the year 2014, it was the highest.
Important Questions from Bar Graph
Study the given graph carefully and answer the question that follows.
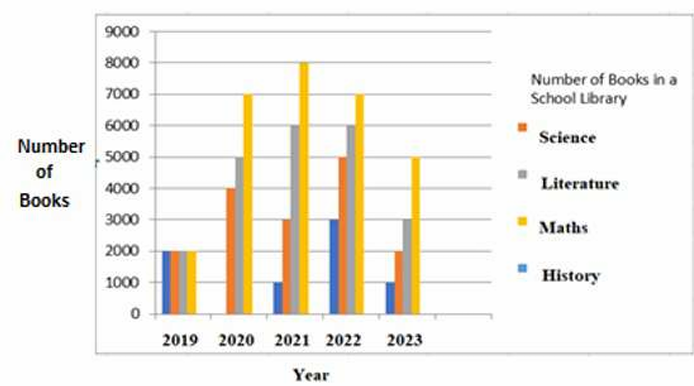
On the basis of this multiple bar graph, what is the change in the number of Literature books from the year 2020 to the year 2023?
Study the given graph carefully and answer the question that follows. The graph shows the demand and production of different companies.
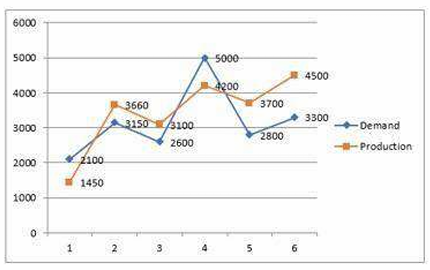
Lowest production is what percentage of the highest demand?
Study the given bar-graph and answer the question that follows.
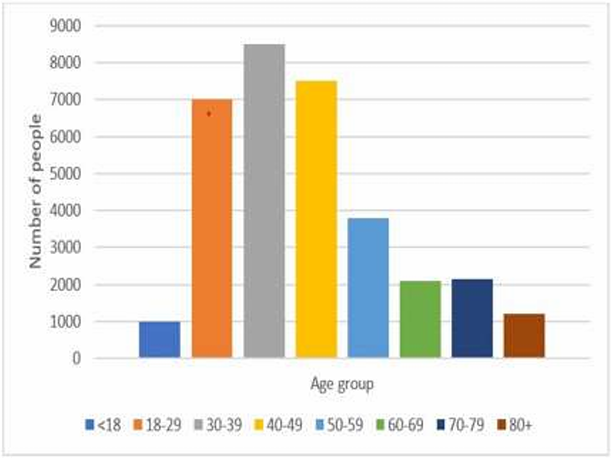
Which age group has the least number of people?
Study the following chart and answer the question that follows:
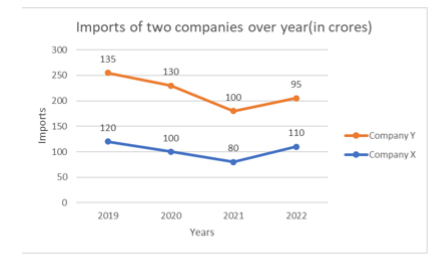
What is the difference in the imports by company X in the years 2019 and 2021?
The ratio of the quantities imported of steel and iron in 2018 was 3 ∶ 2 and in 2020 it was 1 ∶ 1. The ratio of the quantities imported of steel in 2018 and 2020 was 4 ∶ 3. What was the ratio of the quantities imported of iron in 2018 and 2020?