The following line graph shows the population (in million) of Istanbul over 6 years (from 2013 to 2018). Answer the given question based on the line graph. What is the approximate percentage increase in the population of Istanbul from 2013 to 2018?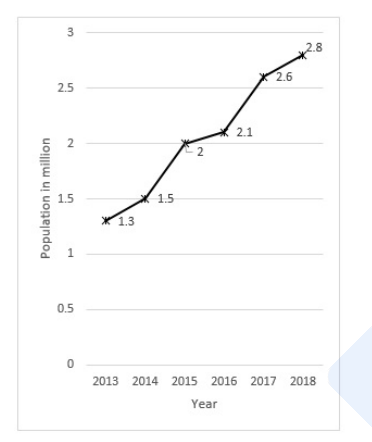
To find the approximate percentage increase in the population of Istanbul from 2013 to 2018, we can use the formula for percentage increase:
Percentage Increase = \(\left(\frac{\text{Final Value} - \text{Initial Value}}{\text{Initial Value}}\right) \times 100%\)
From the line graph, we have the following data:
- Population in 2013 = 1.3 million
- Population in 2018 = 2.8 million
Applying the values to the formula:
- Final Value = 2.8 million
- Initial Value = 1.3 million
Now calculate the increment:
Increment = 2.8 - 1.3 = 1.5 million
Now plug these values into the percentage increase formula:
Percentage Increase = \(\left(\frac{1.5}{1.3}\right) \times 100%\)
Simplify this:
Percentage Increase ≈ \(1.1538 \times 100\%\) = 115.38%
Therefore, the approximate percentage increase in the population of Istanbul from 2013 to 2018 is 115%.
Thus, the correct answer is:
- 115%
Similar Questions
The given line graph shows the total number of course books of Science (S), Drawing (D), Hindi (H), Mathematics (M) and English (E) (in thousand numbers) sold by a printing company in 2017 and 2018. Study the graph carefully and answer the following question.
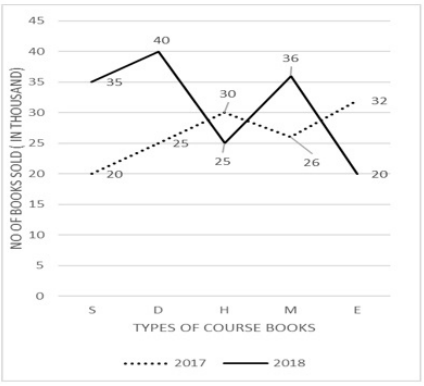
Sales for books in which subject has fallen the most between 2017 and 2018?The following graph shows the profit made by three companies, A, B and C, over 6 years. Answer the question given below based on the graph.
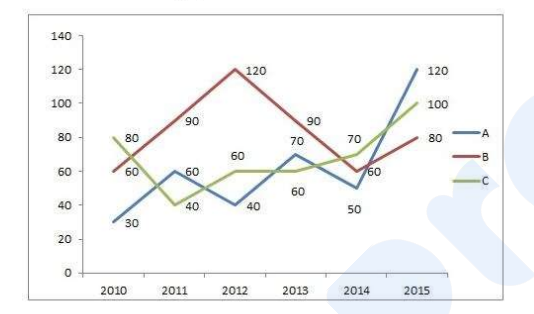
For which two years was the total profit made by the three companies the same?Find total production by company X in all the years (in lakh tonnes).
Which company has recorded lowest range in production figures between 1996 and 2000?
Which company's total production is less than the average production of all the three companies put together for the given period?
If in the year 2000, the production increased by 5% in company X and company Y, then what would be the % increase in total production as compared to the total production reported in the graph above for the same year?
Study the following graph carefully and answer the given question. [Line graph showing production of two companies, A and B, over 5 years]
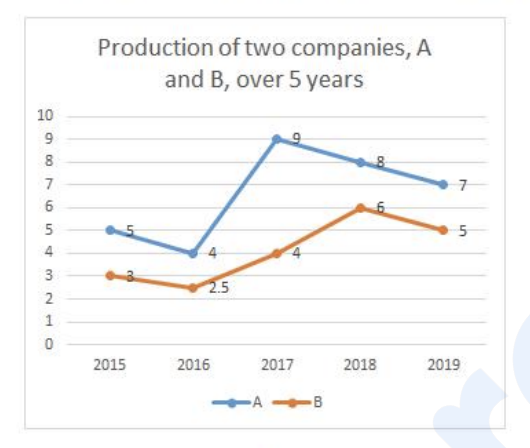
For company A, what is the percentage decrease in the production from 2015 to 2016?Observe the given graph and answer the question.
The graph shows the number of books printed (in lakhs) by a printing company from 2012 to 2017.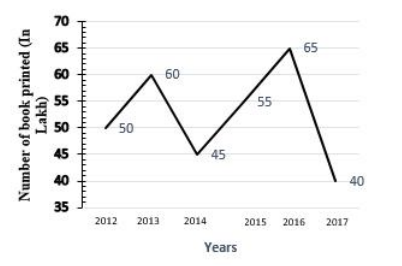
Which year accounted for the maximum percentage increase in the number of books printed?The following graph shows the month-wise cumulative progress in the construction of a dam. If the progress in July is equal to that of the highest progress recorded in any month in the given period, how much work will be completed by the end of July?
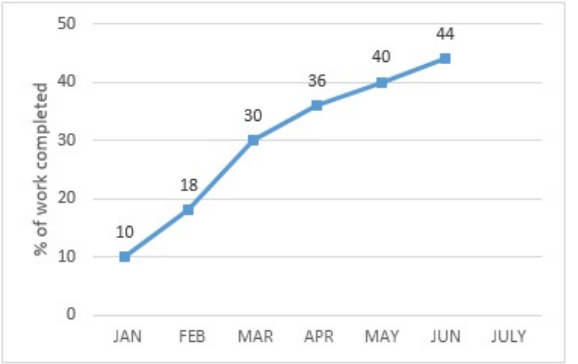
The following line graph shows the number of vacuum cleaners sold by a company over 6 years. Based on the graph answer the question given below.
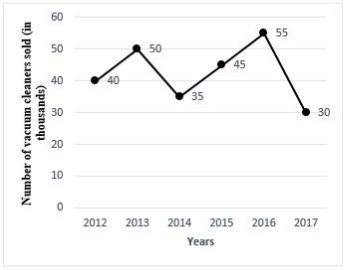
Which of the given years recorded the highest percentage difference (increase or decrease) in sales of vacuum cleaners?
Important Questions from Line Graph
What is the difference between the total production of Ford and Tata motors in the given years?
What is the average number of cars manufactured by Honda over the given period?
The production of Honda in 2018 was approximately what percent of the production of Tata Motors in the same year?
What is the difference between the number of cars manufactured by Ford in the year 2018 and 2019?
What is the average of all the cars manufactured by Tata Motors and Honda in 2016 and 2019?