
The coefficient of determination, $R^2$, represents how well a linear model fits the data. $R^2$ is the sum of squared deviations of observations from the regression line divided by the total sum of squared deviations from the mean value. For the figure below, $R^2$ is closest to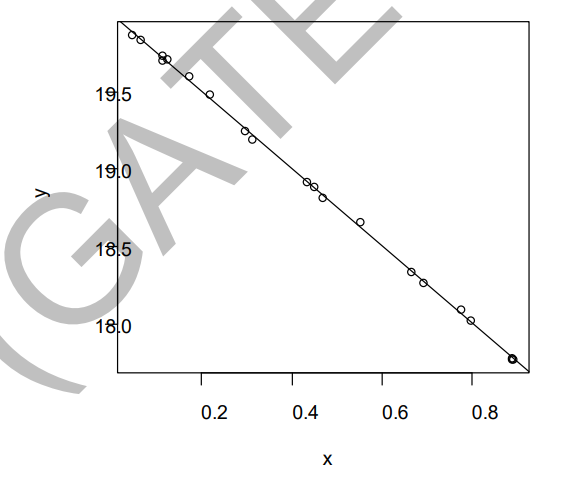
The coefficient of determination, denoted as R^2, measures how well the regression line approximates the real data points. The value of R^2 ranges from 0 to 1, where:
- R^2 = 1 indicates that the regression line perfectly fits the data.
- R^2 = 0 implies that the line does not explain any variability around the mean.
The formula for R^2 is given by:
R^2 = 1 - \frac{\text{SS}_{\text{res}}}{\text{SS}_{\text{tot}}}
- \text{SS}_{\text{res}}: Sum of squares of residuals.
- \text{SS}_{\text{tot}}: Total sum of squares (proportional to the variance of the data).
Looking at the provided graph, the data points lie very close to the regression line, which suggests that most of the variability is explained by the line.
Since the plotted points lie almost perfectly on the straight line, the sum of squared deviations of the observations from the regression line is near zero. Accordingly, the coefficient of determination R^2 approaches 1.
Thus, for the given data, R^2 is closest to 1.
Therefore, the correct answer is:
Important Questions from Regression Analysis
If a constant 60 is subtracted from each of the values of X and Y, then the regression coefficient is
Given the regression lines X + 2Y - 5 = 0, 2X + 3Y - 8 = 0 and Var(X) = 12, the value of Var(Y) is
The standard deviation of Y is double of standard deviation of x. The correlation coefficient between X and Y is 0.5.
The acute angle between lines of regression is
For the variables X, Y and Z, r xy = 0.80, r xz = 0.64, and r yz = 0.79, the square of multiple correlation coefficient \(\rm \mathop R\nolimits_{xyz}^2 \) is:
Dimension reduction methods have the goal of using the correlation structure among the predictor variables to accomplish which of the following:
A. To reduce the number of predictor components
B. To help ensure that these components are dependent
C. To provide a framework for interpretability of the results
D. To help ensure that these components are independent
E. To increase the number of predictor components
Choose the correct answer from the options given below:


