The abundances of three species (P, Q, and R) were measured along a resource gradient. The resultant pattern is summarized in the figure. Which of the following statements can be inferred from niche theory? 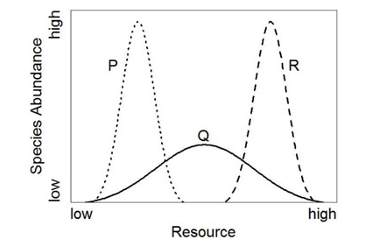
To determine which species are generalists and which are specialists, we analyze the graph of species abundances along a resource gradient.
Niche Theory Basics:
- Generalist Species: These species can survive in a wide range of conditions and utilize various resources. On a graph, this is represented by a broad curve.
- Specialist Species: These species thrive in a narrow range of conditions or utilize a specific resource. On a graph, this is shown by a narrow, peaked curve.
Analysis of Graph:
- P: The curve for species P is narrow and located at one end of the resource gradient. This indicates P is a specialist adapted to specific conditions.
- Q: The curve for species Q is broad, covering a wide range of the resource gradient. This suggests Q is a generalist capable of utilizing various resources.
- R: Like P, the curve for species R is narrow, suggesting it is also a specialist.
Conclusion: Based on niche theory and the graph, Q is a generalist; P and R are specialists. This matches the correct answer option.
Important Questions from Niche
- Species 1 and 2 belong to the same genus and co-occur at the same site. Which one or more of the following strategies would facilitate their coexistence at the site?
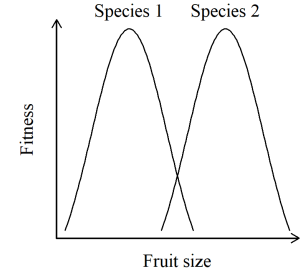
Two species of fruit bats (Species 1 and Species 2) eat fruits of varying sizes. The curves shown represent the ecological niche for these two species. If the curves for both species were to completely overlap, which one or more of the statements given would be correct?
- Which one or more options is/are example(s) of niche partitioning between species?
- Assume that the abundance of a species in a community is proportional to the size of its niche. As each new species colonises this community, an existing niche is split. The resultant relative abundances of species in this community will be most uneven if:
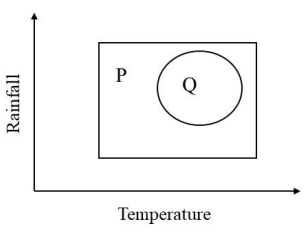
In this figure, the rectangle (P) depicts the range of temperature and rainfall in which a plant species can survive and propagate. The circle (Q) demarcates the range of temperature and rainfall in which this plant species is actually found.
Which one of the following statements about P and Q is accurate for this plant species?