Species Coexistence Strategies Examined
This solution identifies strategies that allow Species 1 and Species 2, which share a genus and co-occur at a site, to coexist. Effective coexistence often relies on reducing direct competition or interspecific interference.
Strategy Analysis: Call Frequencies
Option A suggests Species 1 uses high frequency calls and Species 2 uses low frequency calls. This differentiation in acoustic signals minimizes interference between the species. Reduced communication overlap can be vital for species that share resources or territories, thus facilitating coexistence.
Strategy Analysis: Shared Resource Competition
Option B posits that Species 1 and Species 2 specialize on the same limited resource. Specializing on identical limited resources typically leads to heightened competition. This intense competition is more likely to result in competitive exclusion than coexistence, as one species may outcompete the other.
Strategy Analysis: Nesting Site Partitioning
Option C proposes that Species 1 nests near the ground and Species 2 nests in the canopy. This represents spatial partitioning of habitat resources. Utilizing different nesting locations reduces direct competition for space and nesting materials, contributing to the coexistence of the two species.
Strategy Analysis: Breeding Time Partitioning
Option D indicates that Species 1 and Species 2 breed at different times of the year. This temporal partitioning of breeding activities prevents direct competition for mates and reproductive resources during specific periods. Such temporal separation is a known mechanism that supports species coexistence.
Facilitating Coexistence: Summary
Strategies enabling the coexistence of Species 1 and Species 2 include:
- Option A: Different call frequencies reduce communication interference.
- Option C: Different nesting sites allow for spatial partitioning.
- Option D: Different breeding times enable temporal partitioning.
Option B, specializing on the same limited resource, generally hinders coexistence due to increased competition.
Important Questions from Niche
Two species of fruit bats (Species 1 and Species 2) eat fruits of varying sizes. The curves shown represent the ecological niche for these two species. If the curves for both species were to completely overlap, which one or more of the statements given would be correct?
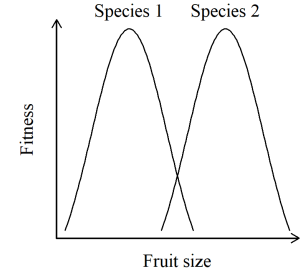
- Which one or more options is/are example(s) of niche partitioning between species?
The abundances of three species (P, Q, and R) were measured along a resource gradient. The resultant pattern is summarized in the figure. Which of the following statements can be inferred from niche theory?
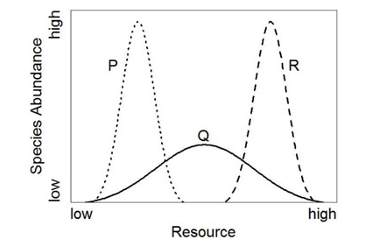
- Assume that the abundance of a species in a community is proportional to the size of its niche. As each new species colonises this community, an existing niche is split. The resultant relative abundances of species in this community will be most uneven if:
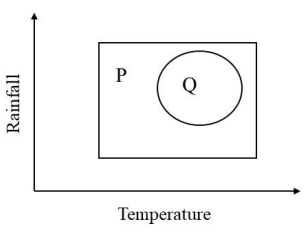
In this figure, the rectangle (P) depicts the range of temperature and rainfall in which a plant species can survive and propagate. The circle (Q) demarcates the range of temperature and rainfall in which this plant species is actually found.
Which one of the following statements about P and Q is accurate for this plant species?