Study the given pie chart that represents the percentage population of six villages A, B, C, D, E and F in 2020, and answer the question that follows. Village Percentage of population below poverty line A 30 B 45 C 55 D 60 E 58 F 40 If the population below poverty line in village D is 42,000, then the total population in all the six villages taken together is: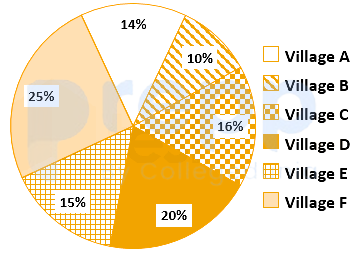
3,50,000
Given:
Population below poverty line in village D is 42,000.
Calculation:
Let the total population of the village is x.
Population of the village D is 20% of the total population.
60% of the population of the village D is below poverty line.
According to question
20% of x × 60% = 42,000
⇒ 1200x/10000 = 42,000
⇒ x = (42000 × 10000)/1200
⇒ x = 3,50,000
∴ T he total population in all the six villages taken together is 3,50,000.
Similar Questions
If amongst other countries. Switzerland accounted for 25% of the Indian tourist traffic, and it is known from official Swiss records that a total of 25 lakh Indian tourists had gone to Switzerland during the year, then find the number of 30-39 years old Indian tourists who went abroad in that year.
The ratio of the number of Indian tourists that went to USA to the number of Indian tourists who were below 30 years of age respectively is∶
The following pie diagram gives the marks scored by a student in different subjects in an examination. Assuming that the total marks scored by the student in the examination are 540, answer the question below
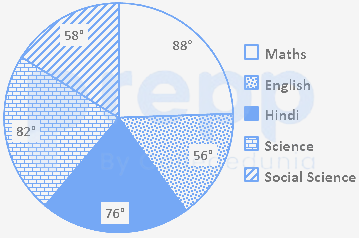
The subject in which the student scored 123 marks is:
If the price of apple is Rs. 50 per kg and that of orange is Rs. 25 per kg, then what is the ratio of their costs at shop A?
If the price of guava is Rs. 12 per kg, that of mango is Rs. 30 per kg, that of apple is Rs. 40 per kg, that of orange is Rs. 20 per kg and that of banana is Rs. 15 per kg, then what is the total cost of all fruits at shop B?
What is the difference between the quantity of mangos at these two fruit shops A and B?
The following pie charts represents the distribution of candidates who were enrolled for an entrance examination and the candidates (out of those enrolled) who passed the examination in different institutes (P, Q, R, S, T, V, X).
Study the charts and answer the question that follows.
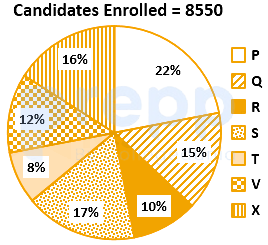
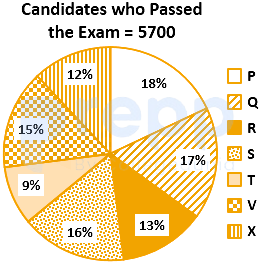
The number of candidates who passed form institutes P and Q together exceeds the number of candidates who enrolled form institutes T and R together by:
The given pie chart the percentage distribution of the expenditure incurred in publishing a book. Study the chart and answer the question that follows.
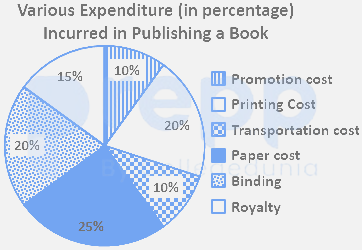
If 2500 copies are published and the printing cost for them amounts to Rs. 160,000, then what should be the selling price of a book such that the publisher can earn a profit of 25%?
The given pie chart shows the percentage distribution of a total of 1600 employees in different departments of a company. The given table shows the ratio of male to female employees in the different departments. Study the pie chart and table and answer the question that follows.
Percentage(%) of Employees in Different Departments

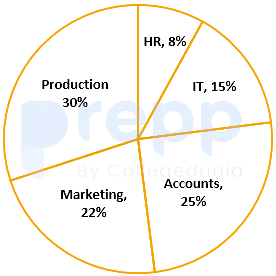
Departments Male : Female HR 3 : 5 IT 2 : 3 Accounts 3 : 7 Marketing 7 : 4 Production 5 : 3 What is the total number of female employees in the company?
Study the given graph and answer the question that follows.
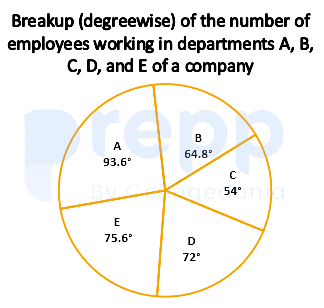
Number of employees in Department B = 432
The total number of employees working in offices A and E is what percentage more than the total number of employees working in offices B and C?
Important Questions from Pie Chart
Study the following pie-charts carefully to answer the questions.
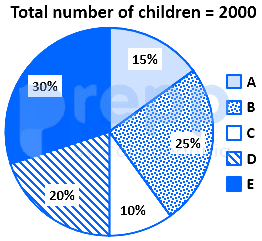
If 70 percent children from village D go to school then what is the number of children attending school from village D ?
Study the following pie-charts carefully to answer the questions.Percentage break-up of number of children in five different villages
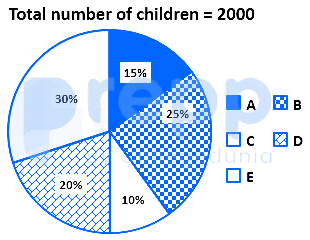
What is the respective ratio of total number of children from village A to village C ?
Study the following pie-charts carefully to answer the questions.Percentage break-up of number of children in five different villages
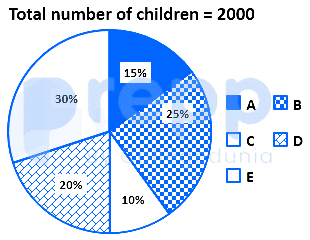
What is the total number of children in villages B and E ?
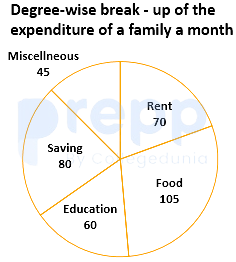
Study the chart and answer the question based, on the pie chart.The pie chart is given below shows expenditures incurred by a family on various items and savings in a month. Savings of the family is ₹ 8,000 in a month.
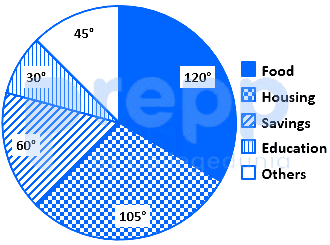
What is the total expenditure of the family for the month?
Study the chart and answer the question based, on the pie chart.The pie chart given below shows expenditures incurred by a family on various items and savings in a month. Savings of the family is ₹ 8,000 in a month.
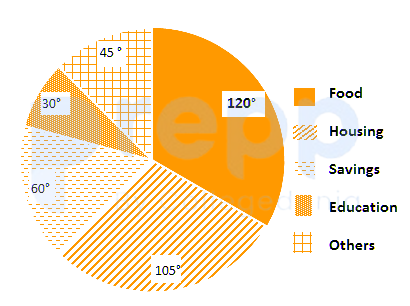
How much more amount is spent on food than on housing?