Study the given graph and answer the question that follows. During 2016 to 2021 , for which year is the production of rice highest?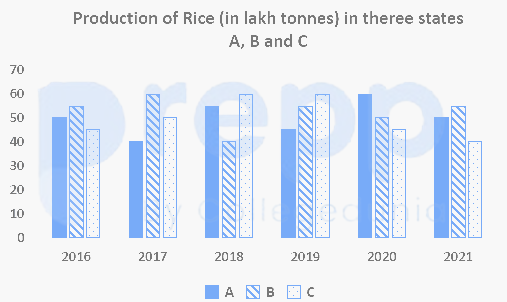
The correct answer is 2019.
total production of rice in the year 2019, is 160 lakh tonnes, which is the highest among all Hence, the production of rice in 2019 is highest .
Similar Questions
The given pie chart shows the degree-wise break-up of the expenditure of a family in a month. The total expenditure of the family is ₹43,200.
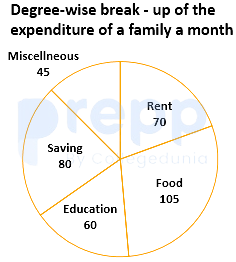
By what percentage is the expenditure on education and rent taken together more than the expenditure on food (correct to two decimal places)?
In 2019, if there is a 10% increase in the population of city A and a 15 % decrease in the population in B as compared to that in 2018, then the population of city A is what percentage more/ less than that in B, in that year? (correct to one decimal places)
The average population of city B for all the given years is what percent less than the total population of city A for 2014, 2016 and 2018?
What is the ratio of the total population of city A for 2013, 2015 and 2017 to the total population of city B for 2015 and 2017?
What is the pass percentage of SSC Students from the village XYX in the year 2012?
What is the pass percentage of SSC students from the village XYX in the year 2011?
This bar diagram shows the income and expenditure (rupees in crores) of a company over 5 years during 2014 to 2018.
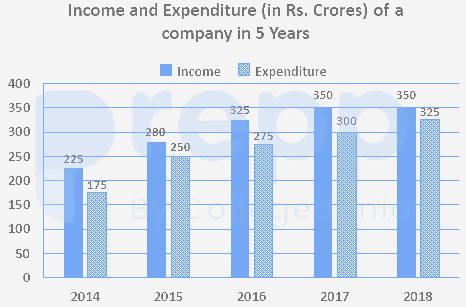
In which year is the ratio of income to expenditure the highest?
The given bar diagram shows the number of students enrolled in Institutions A and B over the course of 5 years (2014 to 2018).
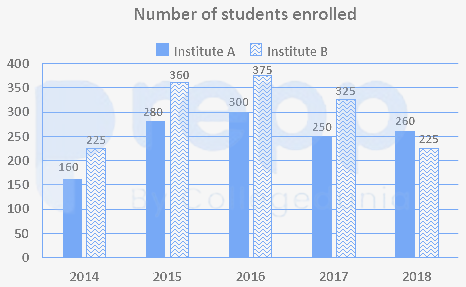
What is the ratio of the average number of students enrolled in Institute B and the average number of students enrolled in Institute A during these years?
The foreign exchange reserves in 1997-98 was how many times that in 1994-95?
Between 1991-1992 and 1998-1999, in which year were in country’s foreign exchange reserves deplete by $1200 MN as compared to the previous year?
Important Questions from Bar Graph
Sales of books from four shops (B1, B2, B3, B4) in thousands are given as below. Study the graph and answer the following questions.
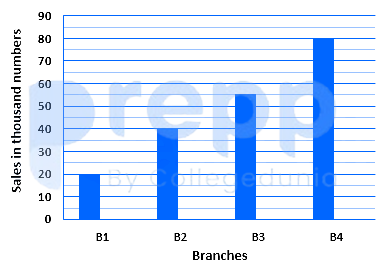
If each shop can increases the sales of books by 10%,then the total number of books(in thousands) soldby all the shop are:
The given pie chart shows the degree-wise break-up of the expenditure of a family in a month. The total expenditure of the family is ₹43,200.
By what percentage is the expenditure on education and rent taken together more than the expenditure on food (correct to two decimal places)?
Which country has the second largest population density?
For the second show the number of audience in Screen 3 is how much more than the number of audience in Screen 1?
The percentage increase in the total production of cars from 2014 to 2018 was