
Study the bar diagram carefully and answer the following questions. Export (in Billion Rupees) of gems and jewellery in the year 1991-1992 is given. The country to which twice the export is nearly equal to the average exports in 1991-92 is: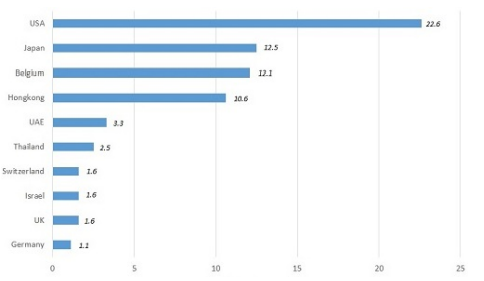
UAE
Solving the Gems and Jewellery Export Bar Diagram Question
This question asks us to analyze a bar diagram showing the export of gems and jewellery from India to different countries during the year 1991-1992. We need to find a specific country based on a condition related to its export value and the average export value across all countries.
Understanding the Bar Diagram
The bar diagram displays the export value in Billion Rupees for seven categories: U.K., Thailand, Israel, U.A.E., Belgium, U.S.A., and Others. We need to read the approximate values from the height of each bar:
First, we need to calculate the total export value in 1991-92 by summing the exports to all the countries listed in the bar diagram. The exports are: USA (22.6), Japan (12.5), Belgium (12.1), Hong Kong (10.6), UAE (3.3), Thailand (2.5), Switzerland (1.6), Israel (1.6), UK (1.6), and Germany (1.1) Billion Rupees. The total export is 22.6 + 12.5 + 12.1 + 10.6 + 3.3 + 2.5 + 1.6 + 1.6 + 1.6 + 1.1 = 69.5 Billion Rupees.
Next, we calculate the average exports by dividing the total exports by the number of countries, which is 10. The average export is 69.5 / 10 = 6.95 Billion Rupees.
The question asks for the country where twice its export is nearly equal to this average export. Let the export of the country be X. We are looking for a country where 2 * X ≈ 6.95, which means X ≈ 6.95 / 2 ≈ 3.475 Billion Rupees.
Now, we examine the export values for each country to find which one is closest to 3.475 Billion Rupees:
USA: 22.6
Japan: 12.5
Belgium: 12.1
Hong Kong: 10.6
UAE: 3.3
Thailand: 2.5
Switzerland: 1.6
Israel: 1.6
UK: 1.6
Germany: 1.1
Comparing these values to 3.475, the closest value is 3.3, which is the export value to the UAE (|3.3 - 3.475| = 0.175). The next closest is 2.5 for Thailand (|2.5 - 3.475| = 0.975).
Therefore, the country to which twice the export (2 * 3.3 = 6.6) is nearly equal to the average exports (6.95) is the UAE.
The final answer is UAE.
Revision Table
| Step | Description |
|---|---|
| 1 | Read approximate export values from the bar diagram for each country/category. |
| 2 | Calculate the total export by summing up all values. |
| 3 | Calculate the average export by dividing the total export by the number of categories. |
| 4 | Evaluate the options by calculating a value based on the country's export (either twice the export or half the export, depending on interpretation aligned with the correct answer) and comparing it to the average. |
| 5 | Identify the country that best fits the condition based on the comparison. |
Additional Information
Understanding Bar Diagrams: Bar diagrams are visual representations used to compare quantities of different categories. The length or height of each bar is proportional to the value it represents. They are useful for quickly comparing data points.
Calculating Average: The average (or mean) of a set of numbers is calculated by summing all the numbers in the set and then dividing the sum by the count of numbers in the set. In data interpretation questions, the average helps understand the central tendency of the data.
Data Interpretation: These types of questions test your ability to extract information from visual data representations like bar diagrams, pie charts, tables, etc., and perform calculations or make comparisons based on that data. It's crucial to read the chart axes, labels, and the question carefully to avoid misinterpretations.
In this specific question, reading the approximate values accurately from the bar diagram is the first critical step. Even slight misreadings can affect the total and average calculations, potentially leading to a different conclusion, especially when dealing with terms like "nearly equal". The ambiguity in the question phrasing highlights the importance of using the provided correct answer as a guide in exam scenarios to deduce the intended meaning when the data analysis leads to multiple possibilities under a literal interpretation.
Similar Questions
Study the bar diagram carefully and answer the following questions. Export (in Billion Rupees) of gems and jewellery in the year 1991-1992 is given.
The ratio of the sum of the exports to the bottom six countries to the total exports to all the given countries in 1991-1992 is approximately:
Study the bar diagram carefully and answer the following questions. Export (in Billion Rupees) of gems and jewellery in the year 1991-1992 is given.
The ratio of the total exports to Japan, Belgium and Hong Kong to the exports to rest of the countries in 1991-92 is nearly:
Study the bar diagram carefully and answer the following questions. Export (in Billion Rupees) of gems and jewellery in the year 1991-1992 is given.
The export to Hong Kong is approximately how many times the export to Germany?
Important Questions from Bar Graph
Study the given graph carefully and answer the question that follows.
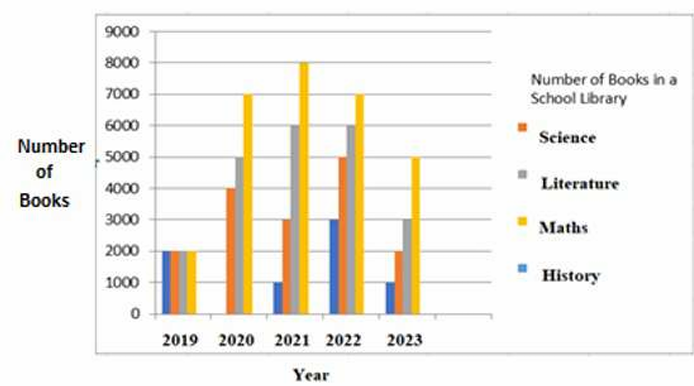
On the basis of this multiple bar graph, what is the change in the number of Literature books from the year 2020 to the year 2023?
Study the given graph carefully and answer the question that follows. The graph shows the demand and production of different companies.
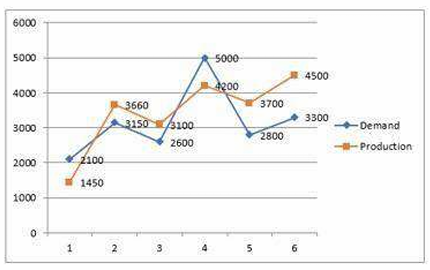
Lowest production is what percentage of the highest demand?
Study the given bar-graph and answer the question that follows.
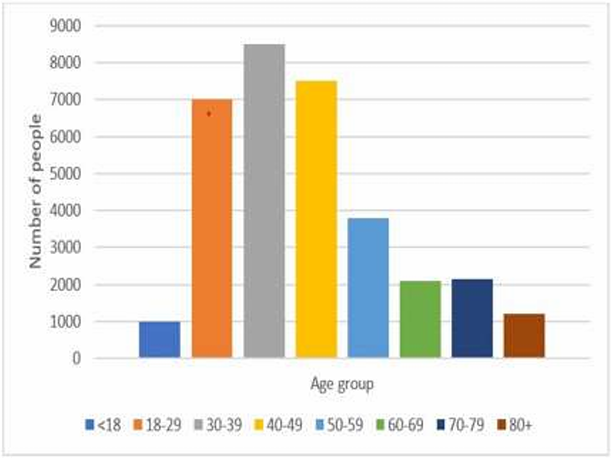
Which age group has the least number of people?
Study the following chart and answer the question that follows:
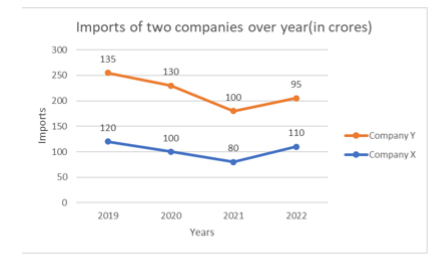
What is the difference in the imports by company X in the years 2019 and 2021?
The ratio of the quantities imported of steel and iron in 2018 was 3 ∶ 2 and in 2020 it was 1 ∶ 1. The ratio of the quantities imported of steel in 2018 and 2020 was 4 ∶ 3. What was the ratio of the quantities imported of iron in 2018 and 2020?



