
The ratio of the quantities imported of steel and iron in 2018 was 3 ∶ 2 and in 2020 it was 1 ∶ 1. The ratio of the quantities imported of steel in 2018 and 2020 was 4 ∶ 3. What was the ratio of the quantities imported of iron in 2018 and 2020?
8 ∶ 9
Understanding the Import Ratio Problem
This question asks us to find the ratio of the quantities of iron imported in two different years, 2018 and 2020, based on given ratios involving steel and iron imports in those years.
We are provided with the following information:
- The ratio of steel to iron imported in 2018 was 3 ∶ 2.
- The ratio of steel to iron imported in 2020 was 1 ∶ 1.
- The ratio of steel imported in 2018 to steel imported in 2020 was 4 ∶ 3.
Our goal is to find the ratio of iron imported in 2018 to iron imported in 2020.
Setting Up the Equations
Let's represent the quantities using variables:
- Let \(S_{2018}\) be the quantity of steel imported in 2018.
- Let \(I_{2018}\) be the quantity of iron imported in 2018.
- Let \(S_{2020}\) be the quantity of steel imported in 2020.
- Let \(I_{2020}\) be the quantity of iron imported in 2020.
Now, let's translate the given ratios into mathematical equations:
From the ratio of steel and iron in 2018:
\(\frac{S_{2018}}{I_{2018}} = \frac{3}{2}\)
This implies \(S_{2018} = \frac{3}{2} I_{2018}\) --- (Equation 1)
From the ratio of steel and iron in 2020:
\(\frac{S_{2020}}{I_{2020}} = \frac{1}{1}\)
This implies \(S_{2020} = I_{2020}\) --- (Equation 2)
From the ratio of steel in 2018 and 2020:
\(\frac{S_{2018}}{S_{2020}} = \frac{4}{3}\) --- (Equation 3)
Solving for the Ratio of Iron Quantities
We want to find the ratio \(\frac{I_{2018}}{I_{2020}}\). We can use the equations we derived.
Substitute Equation 1 and Equation 2 into Equation 3:
\(\frac{S_{2018}}{S_{2020}} = \frac{\frac{3}{2} I_{2018}}{I_{2020}} = \frac{4}{3}\)
Now, we can rearrange this equation to solve for the ratio \(\frac{I_{2018}}{I_{2020}}\):
\(\frac{3}{2} \times \frac{I_{2018}}{I_{2020}} = \frac{4}{3}\)
Multiply both sides by \(\frac{2}{3}\) to isolate the desired ratio:
\(\frac{I_{2018}}{I_{2020}} = \frac{4}{3} \times \frac{2}{3}\)
\(\frac{I_{2018}}{I_{2020}} = \frac{4 \times 2}{3 \times 3}\)
\(\frac{I_{2018}}{I_{2020}} = \frac{8}{9}\)
So, the ratio of the quantities imported of iron in 2018 and 2020 was 8 ∶ 9.
Summary of Ratios
| Item | Year | Quantity | Ratio |
|---|---|---|---|
| Steel : Iron | 2018 | \(S_{2018} : I_{2018}\) | 3 : 2 |
| Steel : Iron | 2020 | \(S_{2020} : I_{2020}\) | 1 : 1 |
| Steel | 2018 : 2020 | \(S_{2018} : S_{2020}\) | 4 : 3 |
| Iron | 2018 : 2020 | \(I_{2018} : I_{2020}\) | 8 : 9 (Calculated) |
Conclusion
By using the given ratios for steel and iron quantities in 2018 and 2020, and the ratio of steel quantities between the two years, we were able to calculate the ratio of iron quantities imported in 2018 and 2020. The calculated ratio is 8 ∶ 9.
Revision Table: Steel and Iron Import Ratios
| Given Information | Mathematical Representation |
|---|---|
| Steel : Iron in 2018 = 3 : 2 | \(S_{2018} / I_{2018} = 3/2\) |
| Steel : Iron in 2020 = 1 : 1 | \(S_{2020} / I_{2020} = 1/1\) |
| Steel in 2018 : Steel in 2020 = 4 : 3 | \(S_{2018} / S_{2020} = 4/3\) |
| Required Ratio: Iron in 2018 : Iron in 2020 | \(I_{2018} / I_{2020} = ?\) |
Additional Information: Understanding Ratios and Proportions
A ratio is a comparison of two quantities. For example, a ratio of 3:2 means that for every 3 units of the first quantity, there are 2 units of the second quantity. Ratios can be written as a fraction (e.g., 3/2).
A proportion is an equation stating that two ratios are equal. In this problem, we used proportions to relate the quantities of steel and iron in different years.
When working with ratios, it's often helpful to express one quantity in terms of another using the given ratio, as shown in the steps above (\(S_{2018} = \frac{3}{2} I_{2018}\) and \(S_{2020} = I_{2020}\)). This allows us to substitute and solve for unknown ratios.
Understanding how to manipulate equations involving ratios is key to solving problems like this one, which combine multiple ratio relationships.
Important Questions from Bar Graph
Study the given graph carefully and answer the question that follows.
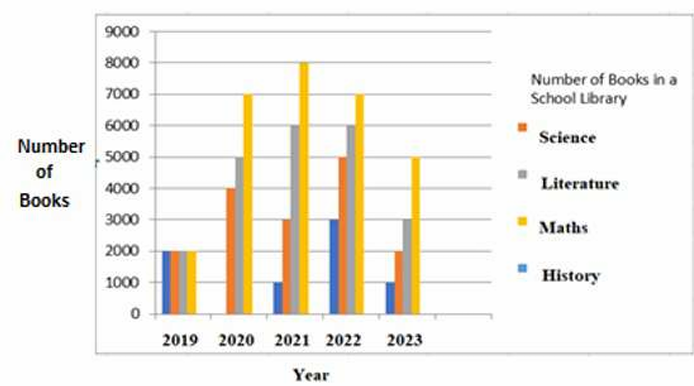
On the basis of this multiple bar graph, what is the change in the number of Literature books from the year 2020 to the year 2023?
Study the given graph carefully and answer the question that follows. The graph shows the demand and production of different companies.
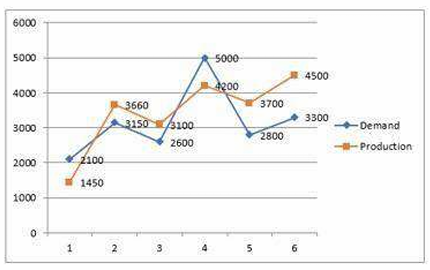
Lowest production is what percentage of the highest demand?
Study the given bar-graph and answer the question that follows.
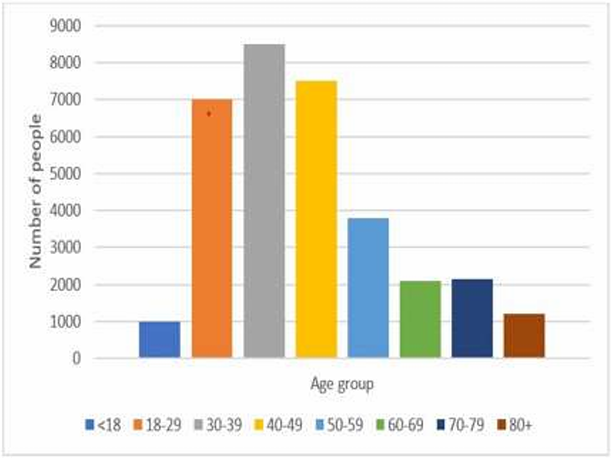
Which age group has the least number of people?
Study the following chart and answer the question that follows:
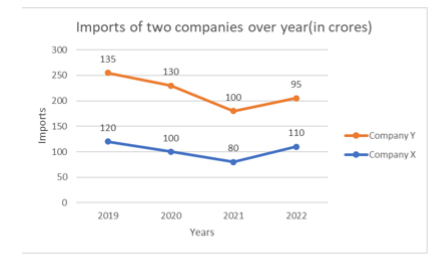
What is the difference in the imports by company X in the years 2019 and 2021?
The difference between the highest and the lowest observations in a data is its


