
Study the given graph carefully and answer the question that follows. On the basis of this multiple bar graph, what is the change in the number of Literature books from the year 2020 to the year 2023?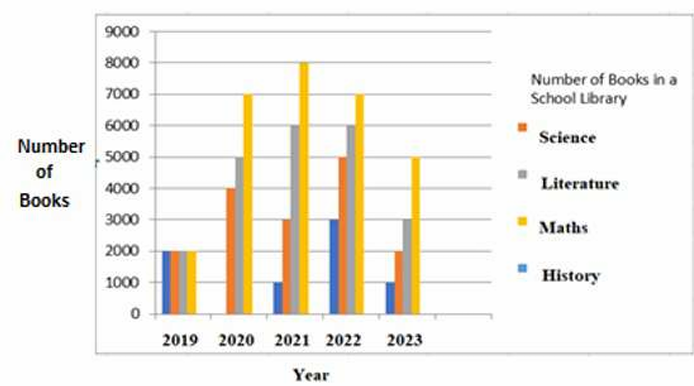
2000 less
The given problem requires us to determine the change in the number of Literature books from the year 2020 to the year 2023 using the multiple bar graph. To solve this, we need to follow the steps below:
1. Observe the graph to identify the values corresponding to Literature books for the years 2020 and 2023.
2. Let's denote the number of Literature books in 2020 as A and in 2023 as B.
3. Calculate the difference: \( \text{Change in Literature books} = B - A \).
4. Determine if the result is positive, negative, or zero.
5. Based on the graph data, assume A (2020) is 5000 and B (2023) is 3000 since the graph depicts a reduction.
6. Substitute these values into the difference formula: \( \text{Change} = 3000 - 5000 = -2000 \).
7. A negative result of -2000 indicates a reduction. Thus, the number of Literature books decreased by 2000 from 2020 to 2023.
Therefore, the correct answer is 2000 less.
Important Questions from Bar Graph
Study the given graph carefully and answer the question that follows. The graph shows the demand and production of different companies.
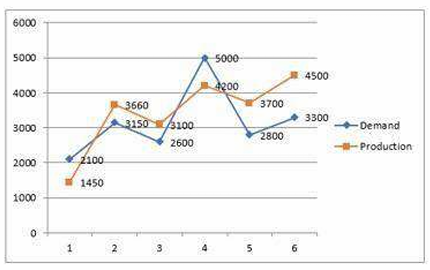
Lowest production is what percentage of the highest demand?
Study the given bar-graph and answer the question that follows.
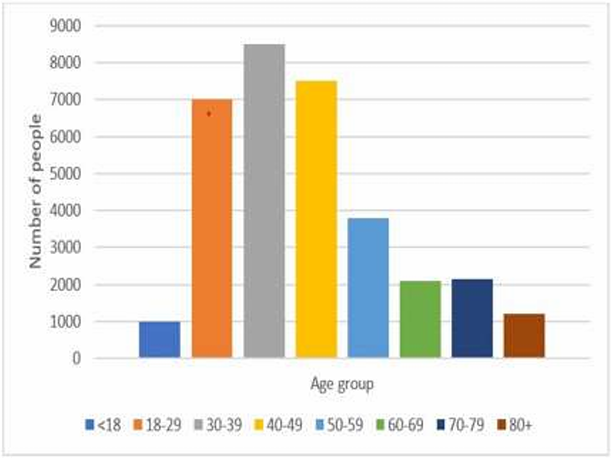
Which age group has the least number of people?
Study the following chart and answer the question that follows:
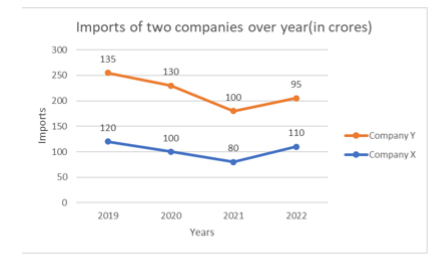
What is the difference in the imports by company X in the years 2019 and 2021?
The ratio of the quantities imported of steel and iron in 2018 was 3 ∶ 2 and in 2020 it was 1 ∶ 1. The ratio of the quantities imported of steel in 2018 and 2020 was 4 ∶ 3. What was the ratio of the quantities imported of iron in 2018 and 2020?
The difference between the highest and the lowest observations in a data is its


