
The difference between the highest and the lowest observations in a data is its
range
Understanding the Range of Data
In the field of statistics and data analysis, when we look at a data set, we often want to understand how spread out the observations are. One simple way to measure this spread is by finding the difference between the highest and the lowest values present in the data.
This specific difference is known as the range. It gives us a quick idea of the overall variability within the data.
What is the Range?
The range of a data set is calculated by subtracting the lowest observation from the highest observation. Mathematically, it is represented as:
\(\text{Range} = \text{Highest Observation} - \text{Lowest Observation}\)
For example, if a data set consists of the numbers 10, 15, 20, 25, 30, the highest observation is 30 and the lowest observation is 10. The range would be \(30 - 10 = 20\).
Why Other Options are Incorrect for Measuring Data Spread (Highest vs Lowest)
- Frequency: Frequency tells us how many times a particular observation or value appears in the data set. It does not measure the difference between the highest and lowest values.
- Width: In the context of grouped data, width usually refers to the class width or the size of an interval. While related to how data is organized, it's not the simple difference between the absolute highest and lowest observations in the entire set.
- Mode: The mode is the observation that appears most frequently in the data set. It indicates the most common value, not the spread between the highest and lowest values.
Therefore, the term that specifically describes the difference between the highest and the lowest observations in a data set is the range.
Important Questions from Bar Graph
Study the given graph carefully and answer the question that follows.
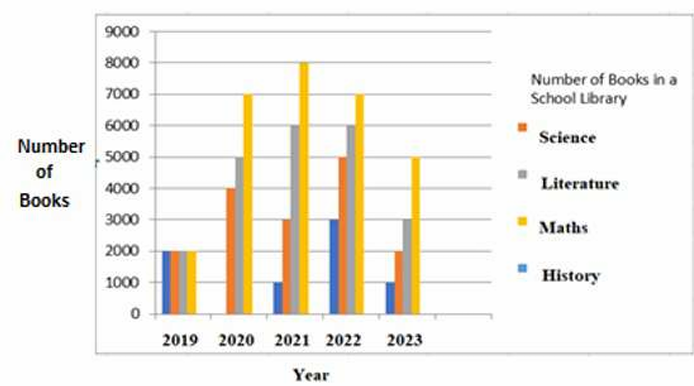
On the basis of this multiple bar graph, what is the change in the number of Literature books from the year 2020 to the year 2023?
Study the given graph carefully and answer the question that follows. The graph shows the demand and production of different companies.
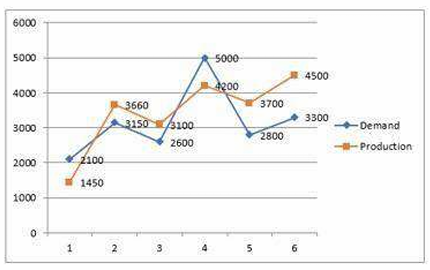
Lowest production is what percentage of the highest demand?
Study the given bar-graph and answer the question that follows.
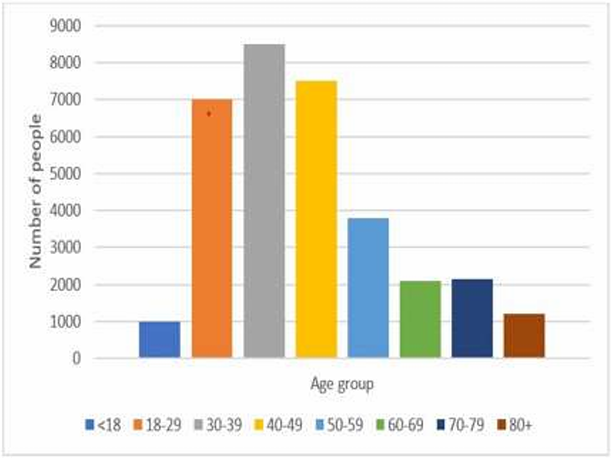
Which age group has the least number of people?
Study the following chart and answer the question that follows:
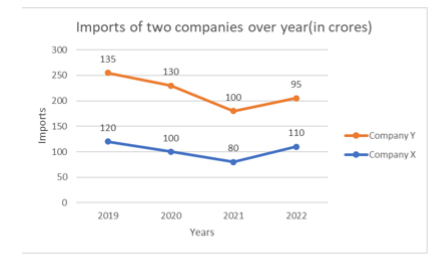
What is the difference in the imports by company X in the years 2019 and 2021?
The ratio of the quantities imported of steel and iron in 2018 was 3 ∶ 2 and in 2020 it was 1 ∶ 1. The ratio of the quantities imported of steel in 2018 and 2020 was 4 ∶ 3. What was the ratio of the quantities imported of iron in 2018 and 2020?


