Headgears, Helmets, Caps
Venn Diagram Analysis: Headgears, Helmets, and Caps
This question requires identifying the correct Venn diagram to represent the relationship between three categories: Headgears, Helmets, and Caps.
Understanding the Categories
- Headgears: This is the broadest category, encompassing any item worn on the head.
- Helmets: A specific type of headgear, often designed for protection (e.g., safety helmets, cycle helmets).
- Caps: Another specific type of headgear, typically softer and less protective than helmets (e.g., baseball caps, beanies).
Establishing the Relationship
- Both Helmets and Caps are specific types of Headgears. Therefore, Helmets and Caps are subsets of Headgears.
- Generally, Helmets and Caps are distinct categories. While there can be overlaps in function or design in niche cases, for standard classification, they are considered separate types within the broader Headgear category.
Identifying the Correct Venn Diagram
The correct Venn diagram should visually represent this hierarchy and distinction:
- A large encompassing circle representing Headgears.
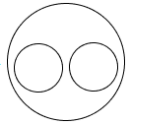
- Two smaller, separate circles entirely within the Headgear circle, representing Helmets and Caps. These circles should not overlap with each other, indicating they are distinct types of headgear.
The Venn diagram presented in Option 4 matches this description precisely. It shows 'Headgears' as the universal set, with 'Helmets' and 'Caps' as distinct subsets within it.
Similar Questions
Select the correct set that represent the following Venn diagram.

- Which of the following Venn diagrams best represents the relationship between squares, quadrilaterals and geometrical figures?
Which of the following Venn diagrams correctly represents the following classes:
Men, Father, Doctor
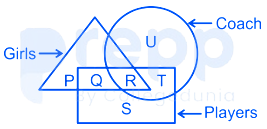
In the following Venn diagram which region represents the coach who is also a player but not a girl?
Which of the following Venn diagrams correctly represents the following classes:
Karnataka, India, Asia
Which of the following diagrams represent the relationship between Male, Husband and Model.
Which of the following Venn diagrams best represents the relationship between apples, fruits and eatables?
Select the correct set that represents the following Venn diagram.
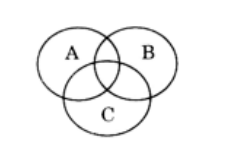
Which of the following Venn diagrams best represents the relationship between Indians, doctors and women?
Select the most suitable Venn diagram to represent the following relationship.
India, Maharashtra and Kerala
Important Questions from Logical Venn Diagram
Select the Venn diagram that best illustrates the relationship among the following classes.
Neptune, Planet, Moon
Teacher, College, Student –
Cabinet, Home Minister, Minister –
Professor, Researcher, Scientist –
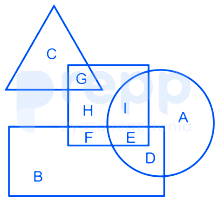
In the following figure, square represents Teachers, triangle represents swimmers, circle represents Nurses and rectangle represents Women. Which set of letters represent Teachers who are either swimmers or nurses?