Monthly expenditure of a family on different heads is shown in the following pie chart. The family earns Rs. 1,08,000 every month. The money (in Rs.) spent on Misc. Expenses is how much more than that spent on Children Education? E xpenditure on different Heads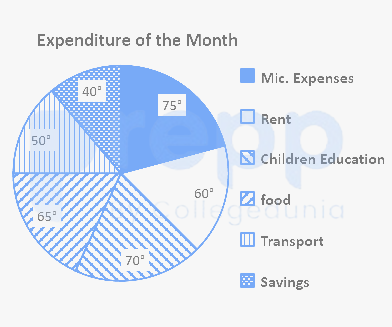
1,500
Given:
There is the monthly expenditure of a family on different heads is shown in the following pie chart.
Income of the family = Rs. 108000/month
Calculation:
The total angle of all expenditures = 75° + 60° + 70° + 65° + 50° + 40° = 360°
The difference between Misc. Expenses and spent on Children's Education = 75° - 70° = 5°
So, the amount differences = (5/360) × 108000 = Rs. 1500
∴ The money (in Rs.) spent on Misc. Expenses are Rs. 1500 more than that spent on Children's Education.
Similar Questions
Airline E sold how many more percentage of tickets than Airline A?
Which airline sold the second highest number of tickets?
The ratio of tickets sold by Airlines A and D to tickets sold by Airline E is?
Mr. Raghav taught Geometry for 36 hours. If the time taken in teaching Ratio consitutes one-fourth of the time for Arithmetic, then for how much time (in hours) did he taught the topic of Ratio?
If the cost of total spending on transport for the seminar was Rs. 9 lakhs and the cost of hosting the students was Rs. 15000 per student then what was the ratio of hosting cost of all the students to that of spending on transport?
What is the angular measure (in degrees) of the sector representing Country A?
By what count (in %) students from Country B at the seminar were more than the students from Country E?
Which is the second biggest expense of the company?
Study the given and answer the question that follows.
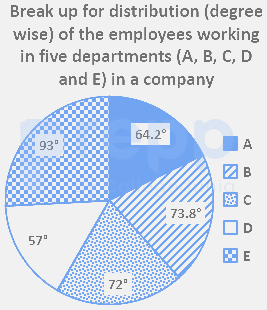
The number of employees = 3000
If 20% of the employees working in department E are transferred to department A, then the difference between the number of employees in A and 124% of the employes working in department C is:
Directions: Study the given graph and answer the question that follows.
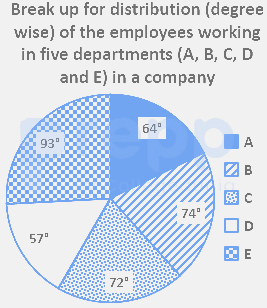
The number of employees = 3000
The number of employees in department B is what percent of the total number of employees working in department D and E?
Important Questions from Pie Chart
Directions:
Study the following graph carefully to answer the given question:
% of students in all the Department
Find the number students in IT and CSE dept.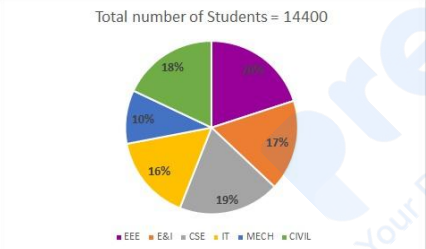
Directions:
Study the following graph carefully to answer the given question:
% of students in all the Department
Find the number students in IT dept.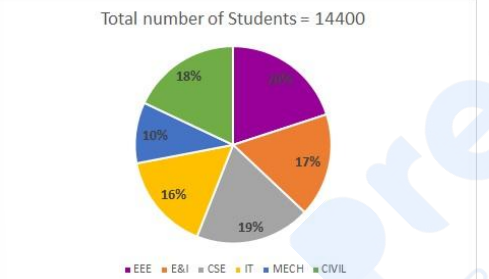
Directions:
Study the following graph carefully to answer the given question:
% of students in all the Department
Find the number students in E & I dept.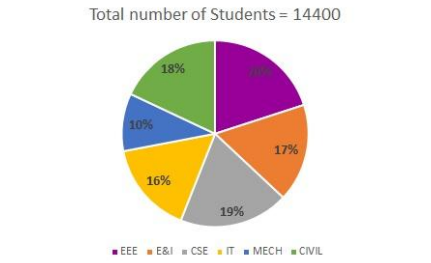
- What is the population of State A and State C together?
- Find the ratio of population of State D to that of State E.