Distribution Mode vs. Mean Relationship
This question asks about the relationship between the Mode and the Mean in a specific type of statistical distribution. Let's explore how these measures behave in different distributions, particularly focusing on skewness.
Understanding Skewness in Distributions
Skewness refers to the asymmetry of a probability distribution. It tells us whether the data is concentrated on one side or if the tail on one side is longer or fatter than the other.
1. Symmetric Distributions
In a perfectly symmetric distribution, the Mean, Median, and Mode are all equal. The data is evenly distributed around the center.
- Mean = Median = Mode
The Normal distribution is a classic example of a symmetric distribution.
2. Positively Skewed Distributions (Right-Skewed)
In a positively skewed distribution, the tail on the right side is longer or fatter than the left side. Most of the data are concentrated on the left side. In this case, the Mean is pulled towards the longer tail (the higher values).
- Mode < Median < Mean
Here, the Mode is the lowest, and the Mean is the highest among the three measures.
3. Negatively Skewed Distributions (Left-Skewed)
In a negatively skewed distribution, the tail on the left side is longer or fatter than the right side. Most of the data are concentrated on the right side. The Mean is pulled towards the longer (left) tail (the lower values).
- Mean < Median < Mode
In this scenario, the Mode is the highest value, followed by the Median, and then the Mean is the lowest.
Answering the Question
The question states that the Mode is found to be higher than the Mean.
Based on our understanding of skewness:
- In symmetric distributions: Mode = Mean.
- In positively skewed distributions: Mode < Mean.
- In negatively skewed distributions: Mode > Mean.
Therefore, the condition where the Mode is higher than the Mean specifically characterizes a Negatively skewed distribution.
Important Questions from Regression Analysis
- Using linear regression (least squares), the best-fit line for the given dataset is $y = 2.2x + 2.3$. Given the residual sum of squares is 25.8, the coefficient of determination ($r^2$), is ______________ . (rounded off to two decimal places)
$x$ 2 3 4 5 $y$ 8 9 7 16 - Given the pairs of values of $(X, Y)$ as $(2, 60)$, $(4, 70)$ and $(6, 90)$, $m$ is the slope of the linear regression plot of $Y$ on $X$. The value of $m$ is _______.
- The data given in the table are fitted to the equation $y = mx$ using the method of least squares. The value of $m$ is ______ (rounded off to one decimal place).
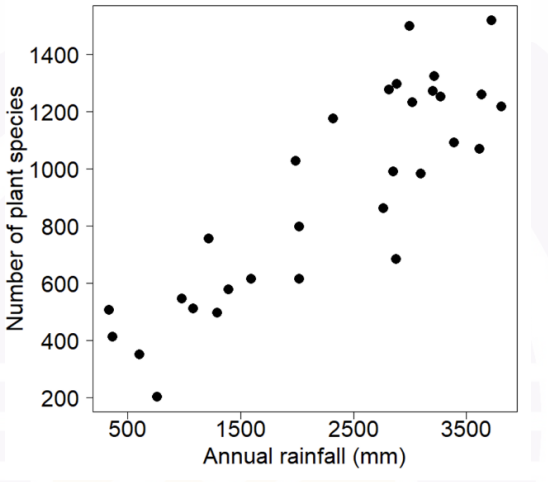
$x$ 1 2 3 4 $y$ 2 6 7 10 The graph below shows a plot of annual rainfall on the X axis and number of plant species on the Y axis. Based on the pattern in the graph, which one of the following statistical methods would be most appropriate to model the relationship between annual rainfall and the number of plant species?
- Arrange the following steps of formulating research proposal in a logical sequential order :
(i) Defining research problem.
(ii) Formulation of hypothesis.
(iii) Review of literature.
(iv) Collection of data.
(v) Research Design.
Choose the correct answer from the options given below :