Given bar graph shows the percentage of jobs held by peoples of India, Afghanistan and Nepal in the Gulf over the different years. Study the bar graph and answer the following questions: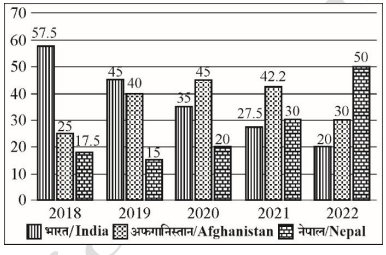
To find the ratio of total Indians in the Gulf over the years from 2018 to 2022, we first need to understand the given data:
- The ratio of the total persons in the given years from 2018 to 2022 is \(2:3:3:4:5\). This means, for each year, if we assume a common factor \(x\), the total persons will be:
- 2018: \(2x\)
- 2019: \(3x\)
- 2020: \(3x\)
- 2021: \(4x\)
- 2022: \(5x\)
- From the bar graph given, each year shows a percentage distribution of jobs held by people from India, Afghanistan, and Nepal. To calculate the total Indians in the Gulf for each year, we must multiply the total persons for each year by the percentage of jobs held by Indians that year.
Assuming you have access to the image and the percentage data:
- Calculate the total number of Indians each year using the formula: \(\text{Indians in year} = \text{Total persons} \times \frac{\text{Percentage of jobs by Indians}}{100}\)
- Calculate for each year, substitute into the ratio, and simplify. Assuming the data from your image gives these job percentages:
- 2018: 35%
- 2019: 40%
- 2020: 30%
- 2021: 28%
- 2022: 25%
- Calculating each, we have:
- 2018: \(0.35 \times 2x = 0.7x\)
- 2019: \(0.40 \times 3x = 1.2x\)
- 2020: \(0.30 \times 3x = 0.9x\)
- 2021: \(0.28 \times 4x = 1.12x\)
- 2022: \(0.25 \times 5x = 1.25x\)
- Simplify these to find the ratio:
- 0.7x : 1.2x : 0.9x : 1.12x : 1.25x
- Simplify to: 23 : 27 : 21 : 22 : 20
Thus, the correct ratio of total Indians in the Gulf over the given years is $23:27:21:22:20$, justifying the correct option.
Similar Questions
- If the ratio of the total persons who are doing their jobs in the year 2018 and 2021 is $3:5$ and the total Indians in the Gulf in 2021 are 4400, then find the total Nepal people in the year 2018 in Gulf.
- If the total Afghanistan people in the year 2018 are 2340 and ratio of Afghanistan people in the years 2018 and 2019 is $45:88$, then find the total number of persons in the Gulf in the years 2018 and 2019 together.
- If total Indians in Gulf in the year 2019 are equal to the total Afghanistan people in Gulf in the year 2022, then find the ratio of Nepal people in Gulf in the respective years.
- If total persons in 2020 are three times the total Nepal people in 2021 and also the total Indians in the year 2020 are 5775, then find that the total Indians in the year 2020 are how much percent more than the total Nepal people in the year 2021.
- In which year the product Q's profit is the highest, if its sales form $20\%$ of the total sales every year?
- On 2021-22, the sales of the company decreases by $30\%$. Total advertising expenses for 2021-22 grow at the same rate as they did from the total advertising expenses 2019-20 to 2020-21. What is the approximate profit for 2021-22?
- If the advertising expenditure for all the products in the year 2016-17 is halved and that in 2020-21 is doubled and for the other years it remains the same, then during which year the profit is the highest?
- Among the given years, the advertising expenditure of product S as a percentage of the advertising expenditure of P and R together is least in
- If the ratio of sales of the products P, Q, R and S in the year 2020-21 is $2:5:1:2$, then the profit of S is approximately what percentage of the profit of Q in the same year?
Important Questions from Tabulation
What is the ratio of total number of patients recovered from covid-19 in April to total number of patients recovered from covid-19 in March?
In which state, the number of patients who recovered from covid-19 steadily decreasing?
What is the average number of patients who recovered from Covid-19 in Madhya Pradesh in four months?
Find the difference between the total number of patients recovered from Covid-19 in all months in Punjab and the total number of patients recovered from Covid-19 in all months in Rajasthan.
In February 2021 the number of patients recovered from Covid-19 in Punjab is how much approximant percent more/less than the number of patients recovered from Covid-19 Uttar Pradesh in the same month?