
Identify the type of error the instrument shows as in the given figure. 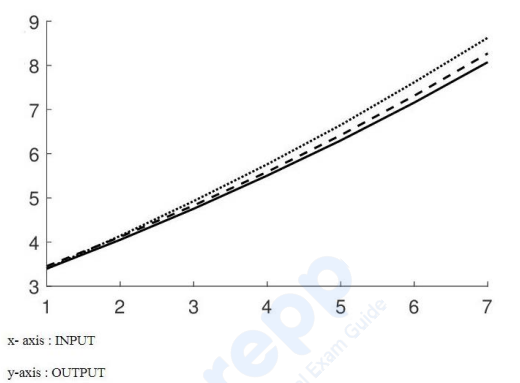
To identify the type of error shown in the given instrument, we need to analyze the graph provided in the figure.
The graph shows the relationship between the input and output of the instrument. Let's discuss the error types one by one:
- Zero Error: This occurs when an instrument does not read zero when the input is zero. In such a case, the entire characteristic curve shifts up or down. The graph shows no such shift from the zero point, so it is not a zero error.
- Span Error: This type of error occurs when the slope of the output characteristic deviates uniformly across the entire input range. The graph does not show a uniform slope deviation; hence, it is not a span error.
- Hysteresis Error: Hysteresis error is when the instrument's output depends on the direction of the input variation, forming a loop. The graph does not depict such behavior, so it is not a hysteresis error.
- Linearity Error: This error occurs when there is a deviation from the ideal straight line between output and input. Upon closer inspection of the graph, it is clear that the actual response deviates from the ideal linear response (shown as the solid line), suggesting a linearity error.
Hence, the correct answer is Linearity Error.
Similar Questions
An ammeter of range 0 to 10 A shows a current of 7.5 A. If its true value is 6.2 A, the relative error is ______.
Important Questions from Error Analysis
- Errors that occur after taking care of all gross and systematic errors are called as:
An ammeter of 0-50 A range has an accuracy of ± 1% of full scale reading. The current measured is 10 A. The uncertainty in measured value is
A 0-200 V voltmeter has an accuracy of 0.75% of full-scale reading. If the voltage measured is 100 V, the error is
Suppose that resistors R1 and R2 are connected in parallel to give an equivalent resistor R. If resistors R1 and R2 have tolerance of 1% each the equivalent resistor R for resistor R1 = 300 Ω and R2 = 200 Ω will have tolerance of
A \(4 \frac 1 2\) digit DMM has the error specification as 0.2% of reading +10 counts. If a d.c. voltage of 100 V is read on its 200 V full-scale, the maximum error that can be expected in the reading is



