Poverty Estimation in India: Key Insights from 2023-24
Why in the News?
The 2023-24 Household Consumption Expenditure Survey (HECS) reveals significant trends in poverty and economic well-being in India. This article provides an in-depth look at its findings, methods, challenges, and recommendations, optimized for search engines to enhance visibility and engagement.
Key Findings of HECS 2023-24
- Purpose of HECS: The survey aims to collect household expenditure data, update the Consumer Price Index (CPI) basket, and measure poverty and inequality.
- Average Monthly Per Capita Consumption Expenditure (MPCE):
- Rural: ₹4,122 (without imputation), ₹4,247 (with imputation).
- Urban: ₹6,996 (without imputation), ₹7,078 (with imputation).
- Urban-Rural Gap: The gap in MPCE reduced from 84% in 2011-12 to 70% in 2023-24, reflecting stronger rural consumption growth.
- Consumption Trends:
- Non-food items make up 53% (rural) and 60% (urban) of MPCE.
- Major expenses:
- Food: Beverages, refreshments, and processed foods.
- Non-Food: Conveyance, clothing, entertainment, and durable goods.
- Inequality Reduction: The Gini coefficient dropped to 0.237 (rural) and 0.284 (urban), indicating reduced consumption inequality compared to 2022-23.
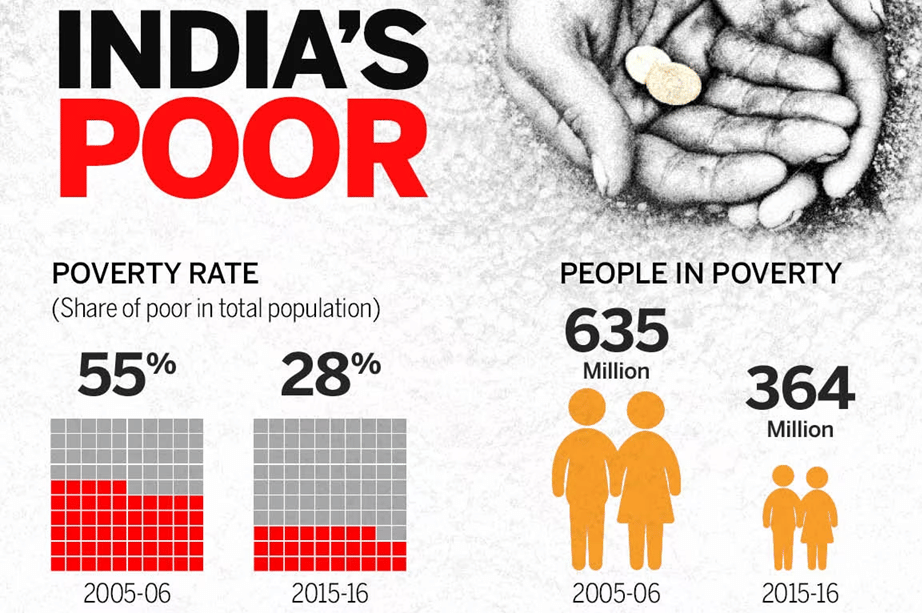
- Poverty Trends: The bottom 5-10% of the population experienced the highest MPCE increase, signaling improvements for lower-income groups.

Methods of Poverty Estimation in India
1. Consumption-Based Poverty Line:
- India’s poverty estimation relies on consumption expenditure rather than income, ensuring stability over time, especially for self-employed individuals and daily wage earners.
2. Data Collection by NSSO:
- The National Sample Survey Office (NSSO), under the Ministry of Statistics and Programme Implementation (MOSPI), gathers consumption data for calculating the poverty line.
3. Role of NITI Aayog:
- NITI Aayog oversees poverty estimation based on expenditure patterns derived from NSSO data.
4. Absolute vs. Relative Poverty:
- Absolute Poverty: Defined by minimum expenditure required for basic needs.
- Relative Poverty: Compares household incomes against national economic standards.
5. Reference Periods:
- Uniform Reference Period (URP): Data collected for a uniform 30-day period.
- Mixed Reference Period (MRP): Combines 30-day and 365-day data for a more comprehensive view.
History of Poverty Estimation in India
- Pre-Independence:
- Dadabhai Naoroji: Estimated poverty at ₹16-₹35 per capita per year.
- National Planning Committee (1938): Proposed ₹15-₹20 per capita per month.
- Bombay Plan (1944): Suggested ₹75 per capita annually.
- Post-Independence:
- Systematic poverty measurement began in 1950, with a focus on food-based poverty lines.
Major Committees on Poverty Estimation:
- Alagh Committee (1979):
- Set calorie-based poverty lines (2,400 calories rural, 2,100 urban).
- Lakdawala Committee (1993):
- Linked poverty lines to state-specific prices, retaining calorie norms.
- Tendulkar Committee (2009):
- Broadened expenditure patterns, including health and education.
- Estimated poverty at 21.9% in 2011-12.
- Rangarajan Committee (2014):
- Revised poverty lines (₹32 rural, ₹47 urban daily).
- Estimated poverty at 29.5% in 2011-12.
Challenges in Poverty Estimation
1. Data Comparability:
- Inconsistent methodologies (URP, MRP) hinder year-to-year comparisons.
2. Divergent Data Sets:
- Differences between NSSO and National Accounts data question reliability.
3. Unclear Poverty Lines:
- Lack of standardization in poverty line updates.
4. Rural-Urban Divide:
- Definitions of rural and urban areas are outdated, based on the 2011 Census.
5. Multidimensional Gaps:
- Indicators in the Multidimensional Poverty Index (MPI) overlook future vulnerabilities.
6. Exclusion of Income Vulnerability:
- Current frameworks lack provisions for income volatility and risks.
7. Policy Criticism:
- Over-reliance on selective data may inflate poverty reduction estimates.
International Standards and Practices
- World Bank:
- Uses $2.15/day (2022) as the international poverty line.
- UNDP:
- Employs the Multidimensional Poverty Index (MPI).
- OECD:
- Focuses on relative poverty to measure income inequality.
- Best Practices:
- Countries like Brazil (Bolsa Familia) and Mexico implement targeted cash transfer programs.
Way Forward for India
1. Standardize Methodologies:
- Adopt a unified approach for consistent and reliable comparisons.
2. Update Poverty Line:
- Reflect changes in consumption and broader well-being.
3. Enhance Data Collection:
- Conduct frequent, comprehensive surveys using technology like GIS mapping.
4. Broaden Indicators:
- Include health, education, and housing in poverty metrics.
5. Strengthen Urban Policies:
- Develop targeted strategies for housing and informal employment.
6. Promote Social Safety Nets:
- Expand schemes like conditional cash transfers and universal basic income.
7. Localized Interventions:
- Tailor policies to address regional disparities and specific needs.
8. Learn from Global Practices:
- Adapt successful models like Bolsa Familia to India’s context.
Download the PREPP App and attempt FREE IAS Exam Mock Tests and get complete study material!

Live Test : UPSC CSE Prelims CSAT (Paper-II) (Oct 08 - 11)
Full Test - 04: UPSC CSE Prelims CSAT (Paper-II)
Full Test - 03: UPSC CSE Prelims CSAT (Paper-II)
UPSC CSE Prelims 2026 GS Paper 1 Question Paper (24-May-2026)
UPSC CSE Prelims 2026 CSAT Paper 2 Question Paper (24-May-2026)

17 February 2025 | The Hindu Must Read Articles | Current Affairs

16 February 2026 | The Hindu Must Read Articles | Current Affairs

13 February 2026 | The Hindu Must Read Articles | Current Affairs









Comments