
Wheat production of a country over a number of years is shown. Which year recorded highest percent reduction in production over the previous year?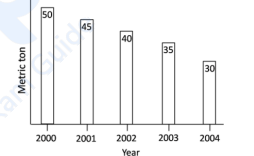
To determine the year with the highest percent reduction in wheat production over the previous year, we need to calculate the percentage decrease for each year compared to its preceding year.
- From the image:
- 2000: 50 metric tons
- 2001: 45 metric tons
- 2002: 40 metric tons
- 2003: 35 metric tons
- 2004: 30 metric tons
- Calculate the percentage reduction for each year:
- 2001: \(\frac{50 - 45}{50} \times 100 = 10\%\)
- 2002: \(\frac{45 - 40}{45} \times 100 = 11.11\%\)
- 2003: \(\frac{40 - 35}{40} \times 100 = 12.5\%\)
- 2004: \(\frac{35 - 30}{35} \times 100 = 14.29\%\)
- Identify the year with the highest reduction:
- 2004 shows the highest percentage reduction of 14.29% over the previous year.
Therefore, the year 2004 recorded the highest percent reduction in wheat production over the previous year.
Important Questions from Data Interpetation (Notes)
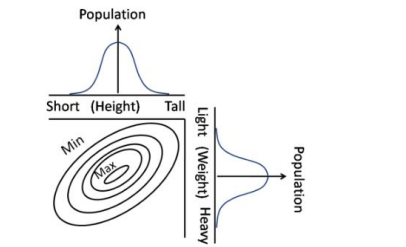
Contours in the bivariate (weight, height) graph connect regions of approximately equal popula-tions. Which of the following interpretations is correct?
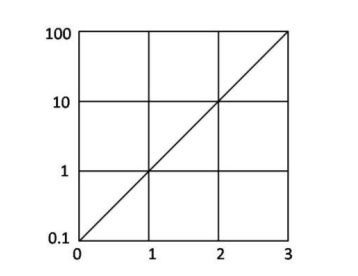
The function $f(x)$ is plotted against $x$ as shown. Extrapolate and find the value of the function at $x = -1$.
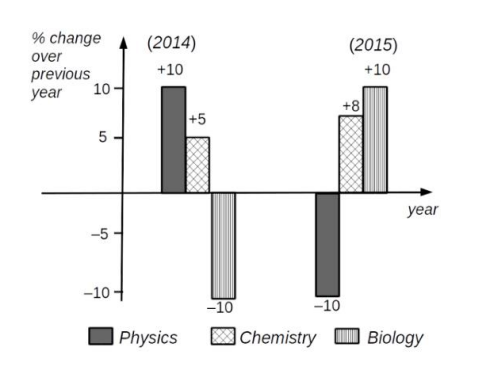
Which of the following inferences can be drawn from the above graph?
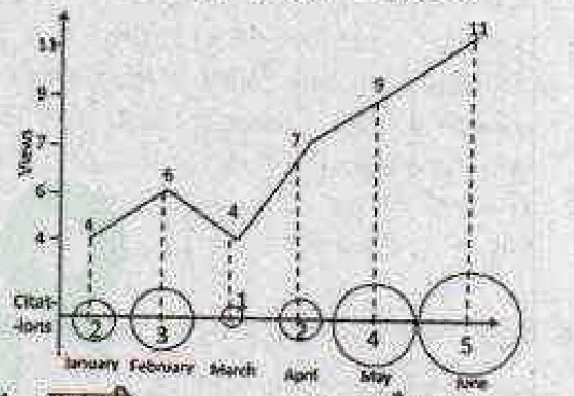
Number of times a research paper is viewed and cited is shown in the plot. In which month was the percentage increase in citation more than the double of the percentage increase in view?
- There are two examinations, A and B in a subject which are evaluated out of 30 and 70 marks, respectively. In order to pass the course the student has to get at least 40 % in total and at least 40 % in B. The following are the marks of the students $S_1$ to $S_4$.
Students A B $S_1$ 12 28 $S_2$ 10 29 $S_3$ 16 27 $S_4$ 05 29
The only student/s to have passed is/are


