
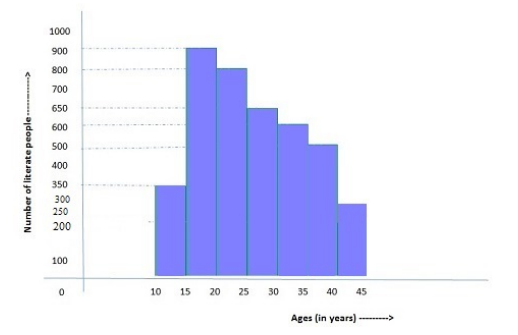
Total number of literate people in the age group 15 to 45 years is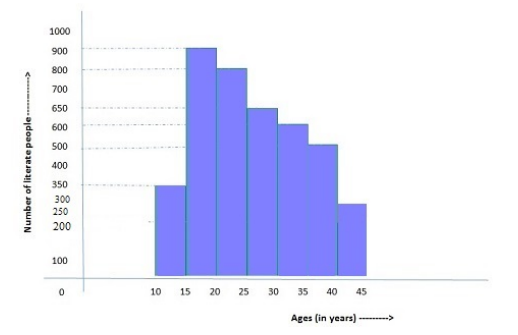
3700
To find the total number of literate people in the age group 15 to 45 years, we need to refer to the provided bar chart:
The chart shows the distribution of literate and illiterate people across different age groups. We are interested in the 15-45 age group. Looking at the chart, we can see that the bar representing literate people in the 15-45 age group reaches the value of 3700.
Therefore, the total number of literate people in the age group 15 to 45 years is 3700.
Similar Questions
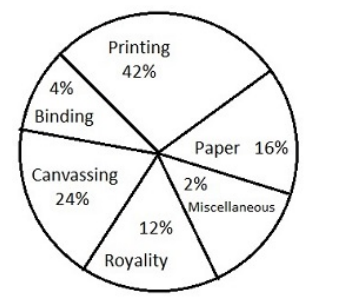
Study the chart and answer the questions. The pie chart given below shows the expenditure incurred in bringing out a book by a publisher.
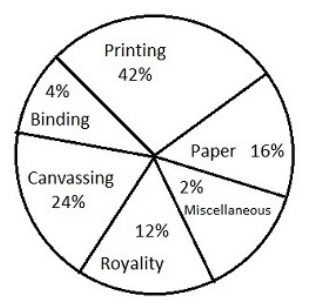
If the cost of printing is Rs. 16,800, the royalty is:
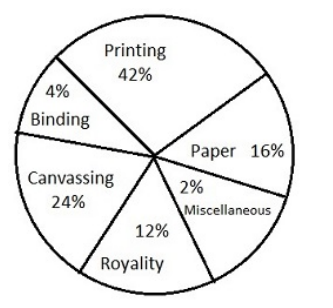
Royalty on the book is less than canvassing expenditure by
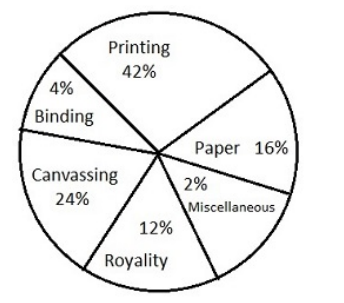
If miscellaneous expenditures amount to Rs. 12000, the expenditure on canvassing will be:
Number of people literate in the age group of 20 to 35 years is
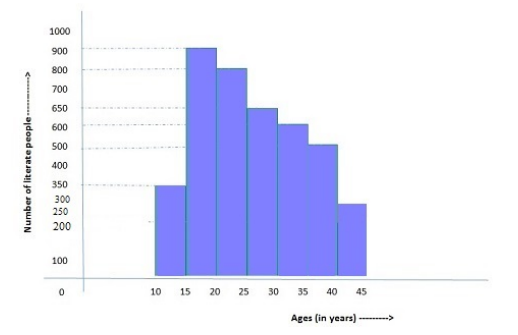
Percentage of the literate people in the age group 30-45 years is
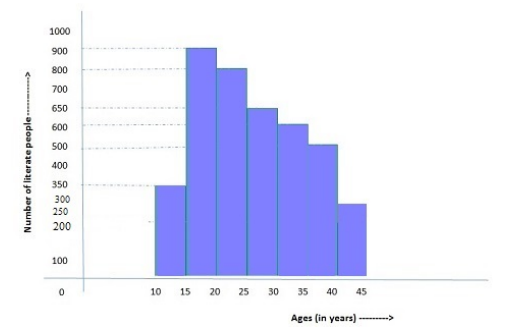
Ratio of literate people in the age group of 20-35 years to that in the age group of 30-45 years is
The bar graph indicates the income of a firm. Study the graph and answer: Which period shows a steady increase of income?
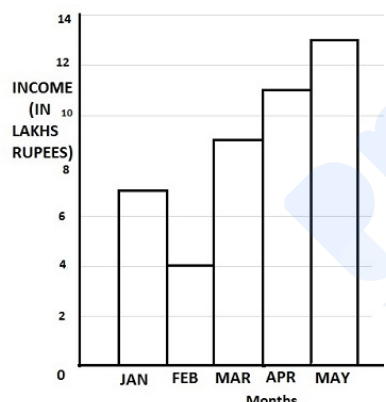
Which period shows a steady increase of income ?The bar graph indicates the income of a firm. Study the graph and answer: During which month, the ratio of the income to that of the previous month is the largest?
During which month, the ratio of the income to that of the previous month is the largest?The bar graph indicates the income of a firm. Study the graph and answer: The income in May is how many times to that of February?
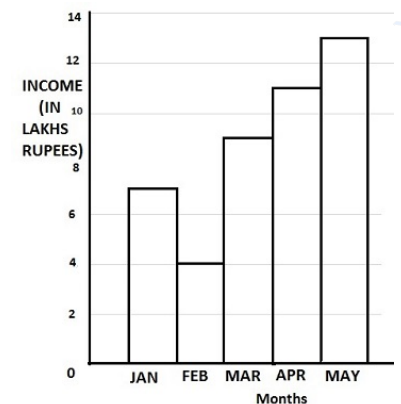
The income in May is how many times to that of February?
Important Questions from Pie Chart
Study the following pie-charts carefully to answer the questions.
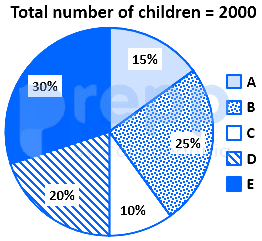
If 70 percent children from village D go to school then what is the number of children attending school from village D ?
Study the following pie-charts carefully to answer the questions.Percentage break-up of number of children in five different villages
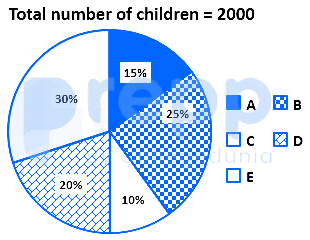
What is the respective ratio of total number of children from village A to village C ?
Study the following pie-charts carefully to answer the questions.Percentage break-up of number of children in five different villages
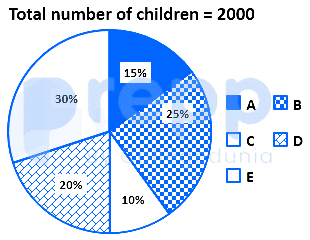
What is the total number of children in villages B and E ?
Study the chart and answer the question based, on the pie chart.The pie chart is given below shows expenditures incurred by a family on various items and savings in a month. Savings of the family is ₹ 8,000 in a month.
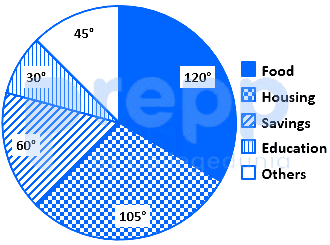
What is the total expenditure of the family for the month?
Study the chart and answer the question based, on the pie chart.The pie chart given below shows expenditures incurred by a family on various items and savings in a month. Savings of the family is ₹ 8,000 in a month.
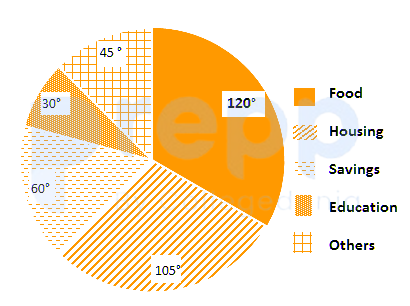
How much more amount is spent on food than on housing?



