
The standard deviation of population P is two times the standard deviation of population Q. The size of a random sample from population P is four times the size of a random sample from population Q. If $e_P$ and $e_Q$ denote the standard error of means of the samples from P and Q, respectively, then the ratio of $e_P$ to $e_Q$ is________.
Calculating Standard Error Ratio ($e_P / e_Q$)
The standard error of the mean ($e$) measures the variability of sample means around the population mean. It is calculated using the population standard deviation ($\sigma$) and the sample size ($n$) with the formula:
$ e = \frac{\sigma}{\sqrt{n}} $Defining Variables and Relationships
- Let $\sigma_P$ and $\sigma_Q$ be the population standard deviations for P and Q.
- Let $n_P$ and $n_Q$ be the sample sizes for P and Q.
- Given: $\sigma_P = 2 \times \sigma_Q$
- Given: $n_P = 4 \times n_Q$
- Let $e_P$ and $e_Q$ be the standard errors of the means for samples from P and Q.
Step-by-Step Calculation
-
Express the standard error for population P:
$ e_P = \frac{\sigma_P}{\sqrt{n_P}} $
-
Express the standard error for population Q:
$ e_Q = \frac{\sigma_Q}{\sqrt{n_Q}} $
-
Calculate the ratio $ e_P / e_Q $:
$ \frac{e_P}{e_Q} = \frac{\sigma_P / \sqrt{n_P}}{\sigma_Q / \sqrt{n_Q}} $
-
Rearrange the terms:
$ \frac{e_P}{e_Q} = \left( \frac{\sigma_P}{\sigma_Q} \right) \times \left( \frac{\sqrt{n_Q}}{\sqrt{n_P}} \right) $
-
Substitute the given relationships ($\sigma_P = 2\sigma_Q$ and $n_P = 4n_Q$):
$ \frac{e_P}{e_Q} = \left( \frac{2\sigma_Q}{\sigma_Q} \right) \times \left( \frac{\sqrt{n_Q}}{\sqrt{4n_Q}} \right) $
-
Simplify the expression:
$ \frac{e_P}{e_Q} = (2) \times \left( \frac{\sqrt{n_Q}}{2\sqrt{n_Q}} \right) $
$ \frac{e_P}{e_Q} = 2 \times \frac{1}{2} $
-
Final Result:
$ \frac{e_P}{e_Q} = 1 $
The ratio of $e_P$ to $e_Q$ is 1.
Important Questions from Sampling Theorems
Four red balls, four green balls and four blue balls are put in a box. Three balls are pulled out of the box at random one after another without replacement. The probability that all the three balls are red is
Three cards were drawn from a pack of 52 cards. The probability that they are a king, a queen, and a jack is
A population (with mean $\mu$) follows normal distribution. Ten samples (N) are drawn at random with a mean value of “x” and standard deviation of “S”. Following table provides the confidence limits, C(t) of the cumulative probability function for Student's t - distribution two-tailed test with degree of freedom, D.
C(t)
D 0.9 0.95 0.975 9 1.38 1.83 2.26 10 1.37 1.81 2.23 11 1.36 1.80 2.20 Which one of the following expression is correct for testing the null hypothesis $H_0: \mu = 0$ at $10\%$ significance level?
- If the sample size ($n$) is 25 and the standard deviation ($\sigma$) of population is 2, then the standard error (SE) of sample mean, (rounded off to one decimal place), is ________.
The probability distribution function of a random variable $X$ is shown in the following figure.
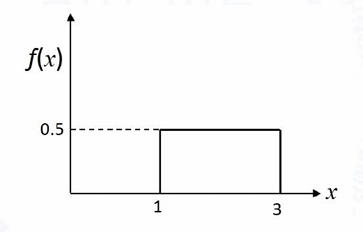
From this distribution, random samples with sample size $n = 68$ are taken. If $\bar{X}$ is the sample mean, the standard deviation of the probability distribution of $\bar{X}$, i.e. $\sigma_{\bar{X}}$ is ________ (round off to 3 decimal places).


