
A population (with mean $\mu$) follows normal distribution. Ten samples (N) are drawn at random with a mean value of “x” and standard deviation of “S”. Following table provides the confidence limits, C(t) of the cumulative probability function for Student's t - distribution two-tailed test with degree of freedom, D. C(t) Which one of the following expression is correct for testing the null hypothesis $H_0: \mu = 0$ at $10\%$ significance level? D 0.9 0.95 0.975 9 1.38 1.83 2.26 10 1.37 1.81 2.23 11 1.36 1.80 2.20
$-1.83 < \frac{X}{\frac{S}{\sqrt{N-1}}} < 1.83$
Hypothesis Testing Objective
The objective is to test the null hypothesis $H_0: \mu = 0$ concerning the population mean ($\mu$) using a sample from a normally distributed population.
Test Parameters Identification
- Sample Size (N): 10
- Significance Level ($\alpha$): 10% or 0.10
- Test Type: Two-tailed test
Degrees of Freedom Calculation
The degrees of freedom (D) for a Student's t-distribution are calculated based on the sample size (N) as $D = N - 1$.
Calculation: $D = 10 - 1 = 9$.
Critical Value Determination
For a two-tailed test with a significance level of $\alpha = 0.10$, the probability in each tail is $\alpha/2 = 0.10 / 2 = 0.05$. We need to find the critical t-value ($t_{critical}$) such that the cumulative probability up to this value is $1 - \alpha/2 = 1 - 0.05 = 0.95$.
Using the provided table for degrees of freedom (D) = 9:
| D | 0.90 | 0.95 | 0.975 |
|---|---|---|---|
| 9 | 1.38 | 1.83 | 2.26 |
| 10 | 1.37 | 1.81 | 2.23 |
Looking at the row for D = 9, the value corresponding to a cumulative probability of 0.95 is 1.83. This is our critical t-value ($t_{critical}$).
Test Statistic Formulation
The test statistic expression provided in the options is:
Test Statistic = $\frac{X}{\frac{S}{\sqrt{N-1}}}$
Where X represents the sample mean, S represents the sample standard deviation, and N is the sample size.
Hypothesis Test Acceptance Region
For a two-tailed test at the 10% significance level, the null hypothesis $H_0: \mu = 0$ is not rejected if the calculated test statistic falls within the range defined by the negative and positive critical t-values:
$-t_{critical} < \text{Test Statistic} < t_{critical}$
Substituting the critical value (1.83) and the test statistic formulation:
$-1.83 < \frac{X}{\frac{S}{\sqrt{N-1}}} < 1.83$
Conclusion Matching Option
The derived condition for not rejecting the null hypothesis exactly matches the expression in Option 2.
Important Questions from Sampling Theorems
Four red balls, four green balls and four blue balls are put in a box. Three balls are pulled out of the box at random one after another without replacement. The probability that all the three balls are red is
Three cards were drawn from a pack of 52 cards. The probability that they are a king, a queen, and a jack is
- If the sample size ($n$) is 25 and the standard deviation ($\sigma$) of population is 2, then the standard error (SE) of sample mean, (rounded off to one decimal place), is ________.
The probability distribution function of a random variable $X$ is shown in the following figure.
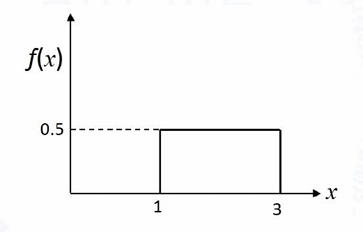
From this distribution, random samples with sample size $n = 68$ are taken. If $\bar{X}$ is the sample mean, the standard deviation of the probability distribution of $\bar{X}$, i.e. $\sigma_{\bar{X}}$ is ________ (round off to 3 decimal places).
The standard deviation of population P is two times the standard deviation of population Q. The size of a random sample from population P is four times the size of a random sample from population Q. If $e_P$ and $e_Q$ denote the standard error of means of the samples from P and Q, respectively, then the ratio of $e_P$ to $e_Q$ is________.


