
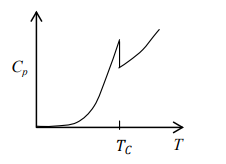
Superconductor Specific Heat Behavior at $T_c$
The specific heat ($C$) of a material indicates how much energy is required to raise its temperature. In superconductors, this behavior changes dramatically at the critical temperature ($T_c$).
- Above $T_c$: In the normal state ($T > T_c$), the specific heat generally increases with temperature. For metals, it often follows a relationship like $C \approx \gamma T + \beta T^3$ at low temperatures, where the electronic contribution ($\gamma T$) is dominant.
- Below $T_c$: In the superconducting state ($T < T_c$), the electronic contribution to the specific heat decreases sharply, often exhibiting an exponential decay at very low temperatures ($C_e \propto e^{-\Delta / (k_B T)}$), where $\Delta$ is the superconducting energy gap.
- At $T_c$: The transition is marked by a distinct feature in the specific heat. Typically, there is a jump or a sharp peak in the specific heat at the superconducting transition temperature ($T_c$). This signifies the phase transition where the material loses its electrical resistance.
Plotting Specific Heat vs. Temperature
The plot of specific heat versus temperature across the superconducting transition ($T_c$) should visually represent these behaviors:
- A rise in specific heat as temperature increases towards $T_c$ from below.
- A sharp increase, jump, or peak exactly at $T_c$.
- A different behavior above $T_c$ compared to below $T_c$.
The graphical representation that shows a sharp peak or jump in specific heat at the transition temperature ($T_c$) is the most appropriate. This feature distinguishes the superconducting phase transition from other thermal transitions.
Referencing the provided options, the plot showing a distinct peak or jump at $T_c$ accurately represents the specific heat behavior during the superconducting transition.
Important Questions from Superconductivity Meissner Effect BCS Theory
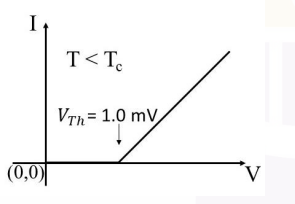
Consider a metal-superconductor junction connected to a dc voltage $V$. At $T < T_c$, where $T_c$ is the superconductor's transition temperature, the current $I$ versus $V$ behavior of this junction is shown schematically in the figure below. If the superconducting energy gap is $D \text{ meV}$. The value of $D$ (rounded off to one decimal place) is _____
- Which of the following option(s) is/are correct for a Type I superconductor?
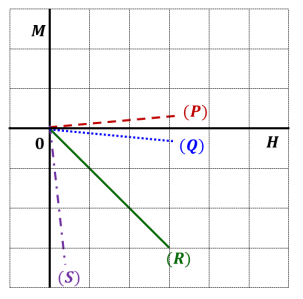
The figure schematically shows the $M$ (magnetization) - $H$ (magnetic field) plots for certain types of materials. Here $M$ and $H$ are plotted in the same scale and units. Which one of the following is the most appropriate combination?
- A material behaves as a superconductor below a critical temperature $T_c$ and as a normal conductor above $T_c$. A magnetic field $\vec{B} = B\hat{z}$ is applied when $T > T_c$. The material is then cooled below $T_c$ in the presence of $\vec{B}$. Which of the following figure represent the correct configuration of magnetic field lines?
- Amongst electrical resistivity ($\rho$), thermal conductivity ($\kappa$), specific heat ($C$), Young's modulus ($Y$), and magnetic susceptibility ($\chi$), which quantities show a sharp change at the superconducting transition temperature?


