
The graph shows the relationship between a variable on the x-axis and genetic diversity on the y-axis. Each point represents a species and the trend line describes the relationship across species.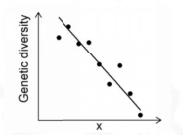
Select the most appropriate variable for the x-axis.
Body size
To identify the most appropriate variable for the x-axis, we must determine which of the provided options exhibits a negative correlation with genetic diversity, as shown by the downward-sloping trend line in the graph.
1. Understanding Genetic Diversity
Genetic diversity within a species is primarily influenced by the effective population size (\(N_e\)). Larger populations generally maintain higher levels of genetic variation because they are less affected by genetic drift, which tends to eliminate alleles in small populations.
2. Evaluating the Options
- Evolutionary age of species: Generally, older species have had more time to accumulate mutations, which often leads to higher genetic diversity (positive or neutral correlation).
- Abundance: Higher abundance means a larger population. Larger populations have higher genetic diversity due to reduced genetic drift (positive correlation).
- Body size: There is a well-established ecological trade-off where larger-bodied species typically have lower population densities and smaller total population sizes compared to smaller-bodied species. Consequently, large animals often have lower genetic diversity. This represents a negative correlation: $$\text{Body Size} \uparrow \implies \text{Population Size} \downarrow \implies \text{Genetic Diversity} \downarrow$$
- Geographic range: Species with wider geographic ranges usually have larger populations and occupy diverse habitats, both of which tend to increase genetic diversity (positive correlation).
Conclusion
Since the graph shows that genetic diversity decreases as variable \(X\) increases, the only variable among the choices that fits this inverse relationship is Body size.
The correct variable for the x-axis is Body size.
Important Questions from Allele frequencies
- In a population, the frequency of an allele changes with time as given in the table:Which one of the following describes how allele frequency changes with year?
Year (x) 0 10 20 30 40 Allele frequency (y) 0.1 0.2 0.3 0.4 0.5 - The frequency of an allele at a locus on the non-recombining region of the Y chromosome in humans is 0.3. If the population size is N and the sex ratio is 1:1, what is the number of copies of the alleles in the population?
- Consider a diploid population at Hardy-Weinberg equilibrium. For a locus with two alleles, the frequency of the $A_1A_1$ genotype is 0.01. The frequency of heterozygotes $A_1A_2$ is ________ (answer up to 2 decimal places).
- There are N individuals in a haploid population. At a given locus, there are 2 alleles, AL1 and AL2. The number of copies of allele AL1 is Z1, and the number of copies of allele AL2 is Z2 in the population. What is the frequency of allele AL2?


