
Hardy-Weinberg Calculation: Heterozygote Frequency
This solution explains how to calculate the frequency of heterozygotes ($A_1A_2$) in a population that is at Hardy-Weinberg equilibrium. We are given the frequency of the $A_1A_1$ genotype.
Allele Frequency ($p$) from $A_1A_1$ Genotype
The Hardy-Weinberg principle states that genotype frequencies are related to allele frequencies. For a population at equilibrium, the frequency of the homozygous genotype $A_1A_1$ is equal to $p^2$, where $p$ is the frequency of the $A_1$ allele.
We are given:
$ \text{Frequency}(A_1A_1) = p^2 = 0.01 $
To find the frequency of the $A_1$ allele ($p$), we take the square root:
$ p = \sqrt{0.01} $
$ p = 0.1 $
Allele Frequency ($q$) Calculation
In a population with two alleles ($A_1$ and $A_2$), the sum of their frequencies must equal 1 ($p + q = 1$). Using the calculated frequency of $A_1$ ($p$), we can find the frequency of the $A_2$ allele ($q$):
$ q = 1 - p $
$ q = 1 - 0.1 $
$ q = 0.9 $
Heterozygote Frequency ($A_1A_2$) Calculation
The frequency of the heterozygote genotype $A_1A_2$ in a Hardy-Weinberg equilibrium population is given by the expression $2pq$. Substituting the calculated allele frequencies $p=0.1$ and $q=0.9$:
$ \text{Frequency}(A_1A_2) = 2pq $
$ \text{Frequency}(A_1A_2) = 2 \times 0.1 \times 0.9 $
$ \text{Frequency}(A_1A_2) = 2 \times 0.09 $
$ \text{Frequency}(A_1A_2) = 0.18 $
Final Result: Heterozygote Frequency
The frequency of the heterozygotes $A_1A_2$ is calculated to be 0.18. This value is consistent with the provided answer range (0.179 to 0.181) and meets the requirement of being expressed up to 2 decimal places.
Important Questions from Allele frequencies
- In a population, the frequency of an allele changes with time as given in the table:Which one of the following describes how allele frequency changes with year?
Year (x) 0 10 20 30 40 Allele frequency (y) 0.1 0.2 0.3 0.4 0.5 - The frequency of an allele at a locus on the non-recombining region of the Y chromosome in humans is 0.3. If the population size is N and the sex ratio is 1:1, what is the number of copies of the alleles in the population?
The graph shows the relationship between a variable on the x-axis and genetic diversity on the y-axis. Each point represents a species and the trend line describes the relationship across species.
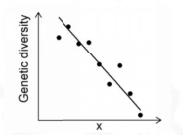
Select the most appropriate variable for the x-axis.- There are N individuals in a haploid population. At a given locus, there are 2 alleles, AL1 and AL2. The number of copies of allele AL1 is Z1, and the number of copies of allele AL2 is Z2 in the population. What is the frequency of allele AL2?


